Two-Stage Op-Amp
Creating a New Project

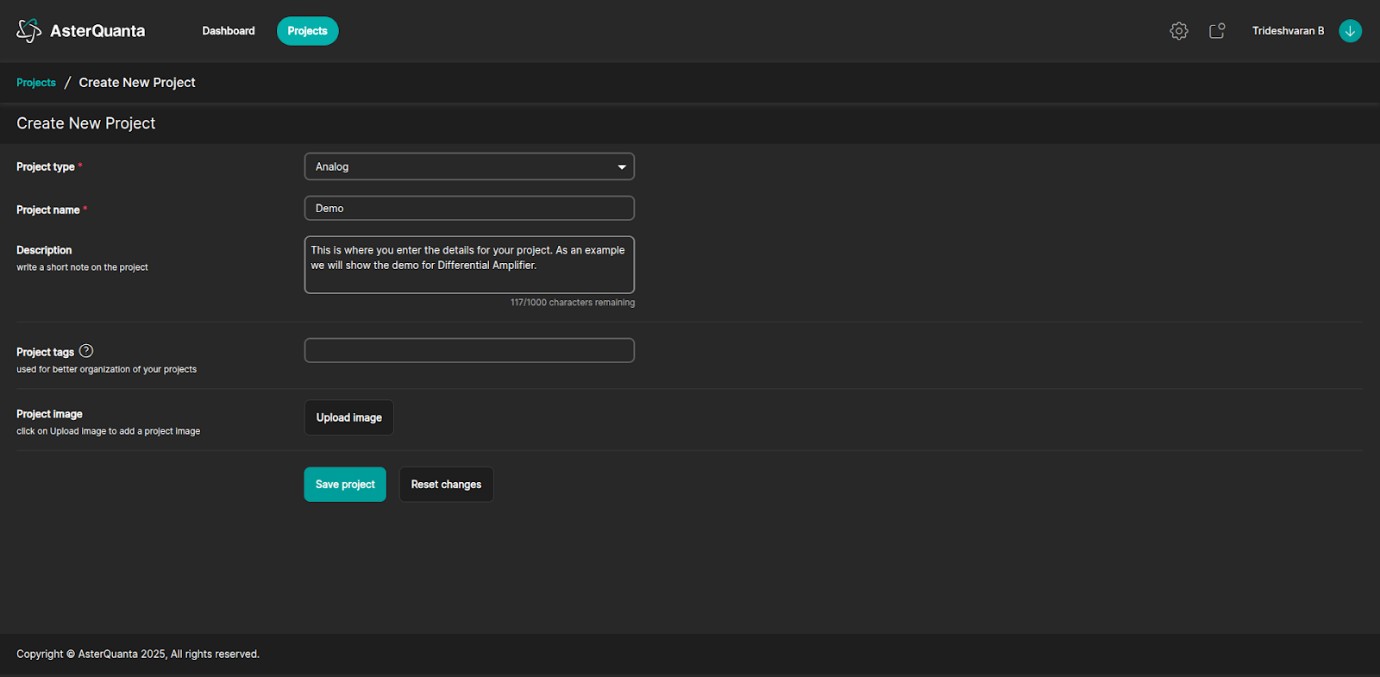
Create a new project by clicking "Add New Project". A single project can contain multiple related circuits.
Upon clicking "Add New Project", you will be prompted to enter:
- Project Type - Select Analog
- Project Name - Enter the project name
- Description - Write a short note on the project
- Project Tags - Used for better organization of your projects
- Project Image - Click on Upload image to add a project image (Image of the base circuit)
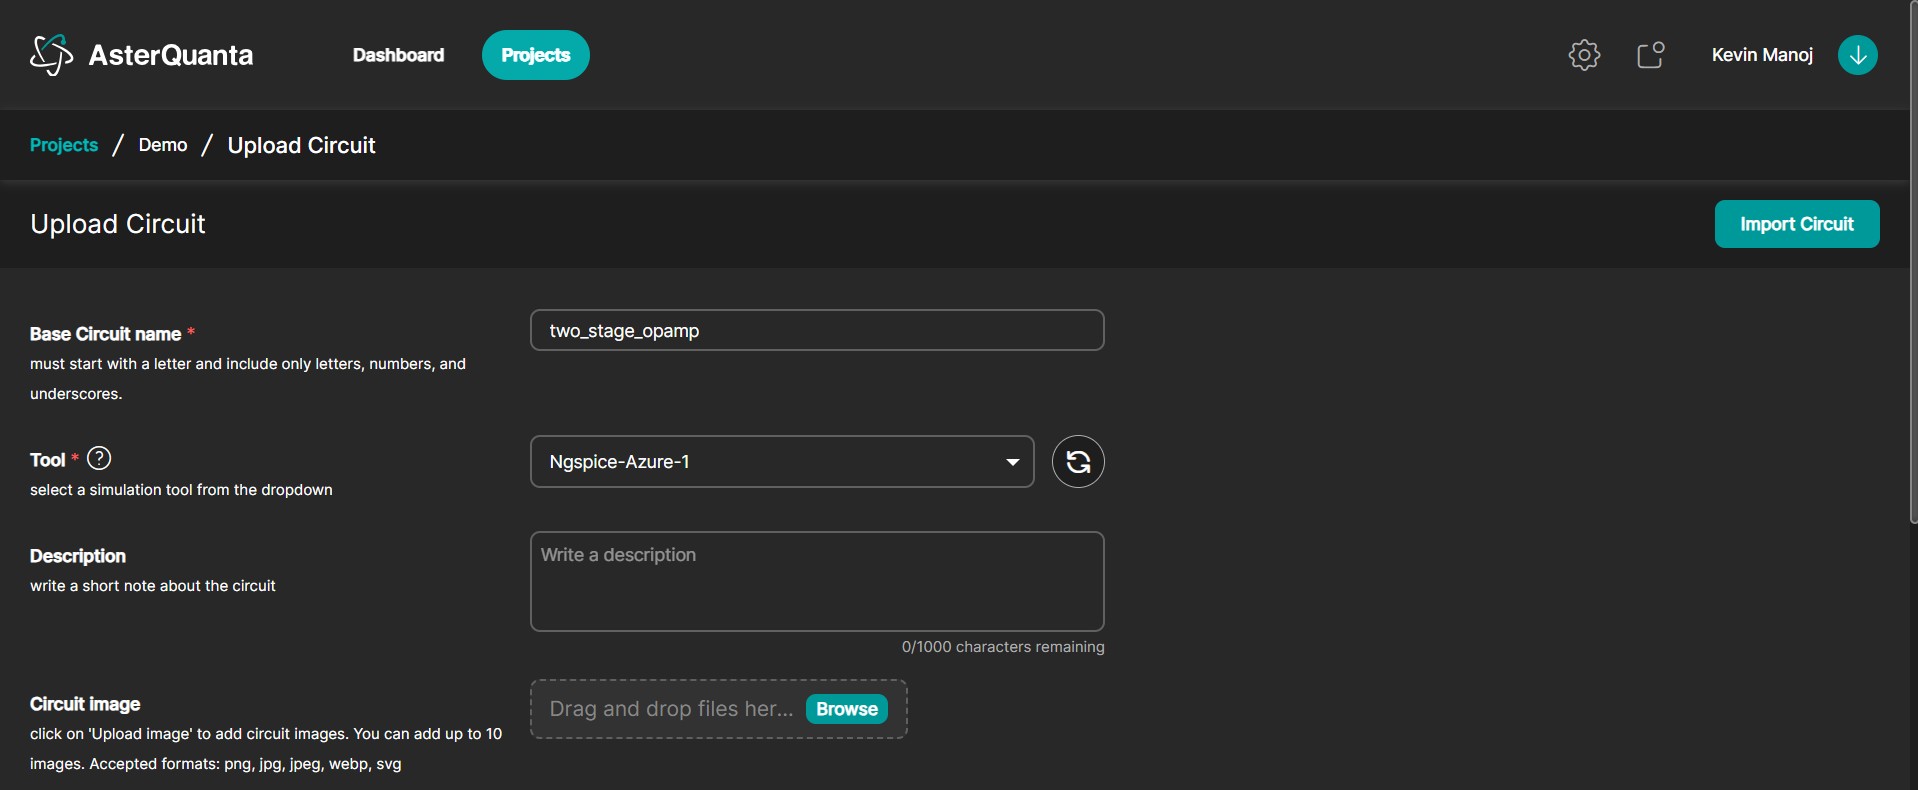
After that, you are redirected to the Upload Circuit page.
Base Circuit Details
- Base Circuit Name - Enter the base circuit name
- Tool - Select the schematic/simulation tool being used. For this tutorial, Ngspice is selected
- Description - Enter a description for the base circuit
- Circuit Image - Upload an image of the base circuit
Test Bench Details
- Circuit Schematic - Upload the
.spice(netlist) file corresponding to your circuit. In this tutorial, a two-stage op-amp (two_stage_opamp) is used - Circuit Image - Upload schematic images or screenshots. You may upload:
- Circuit schematics
- Input waveforms
- Output waveforms
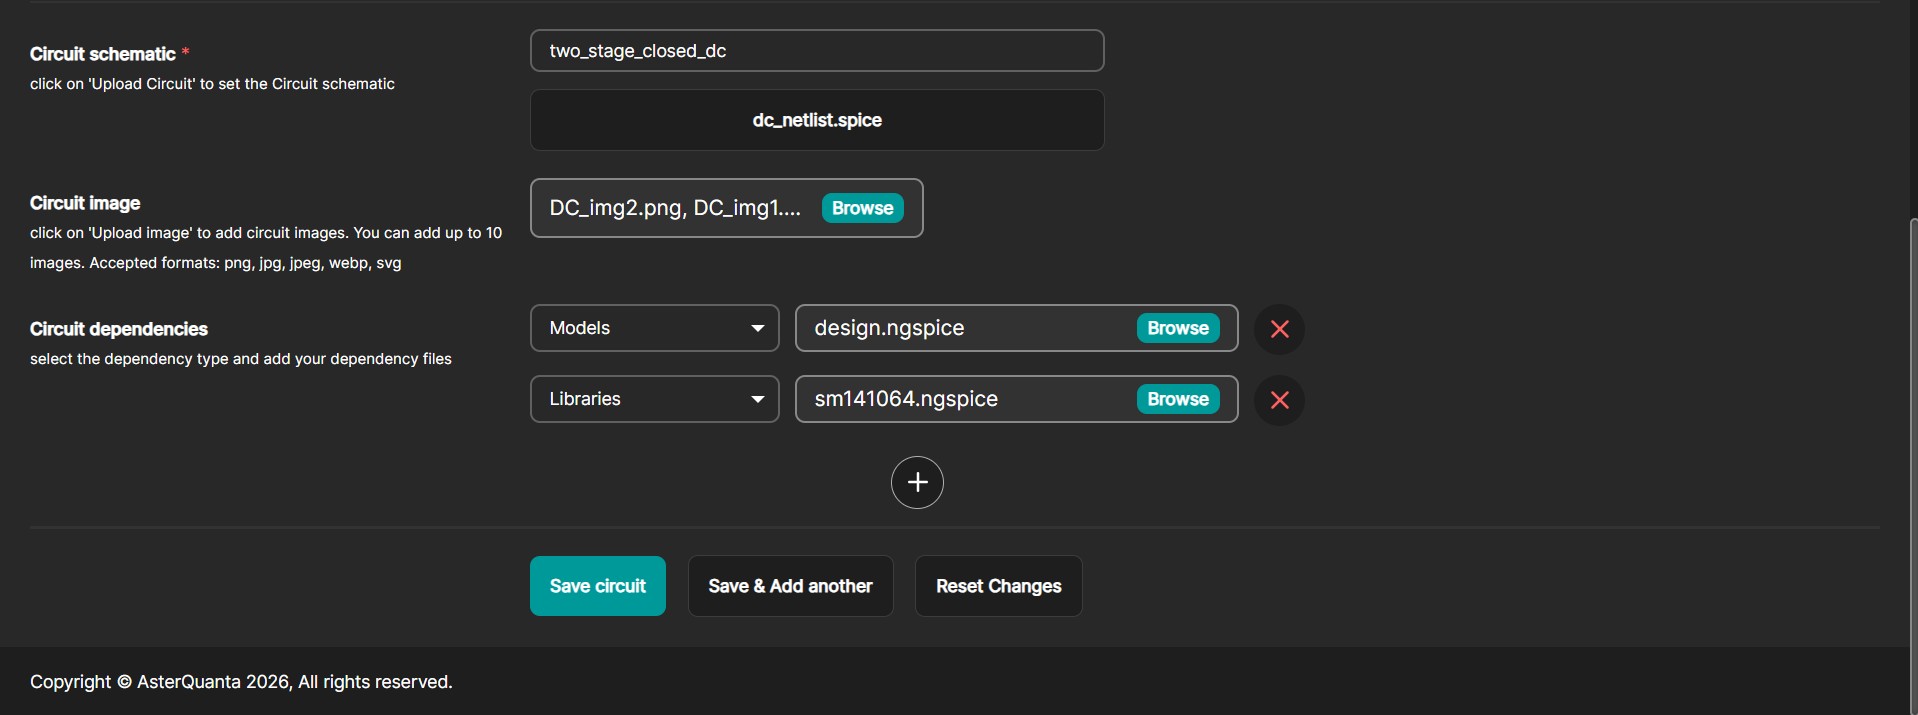
Circuit Dependencies
For your circuit dependencies, make sure for this specific project, you add the two required ones:
- Models - Which you will get from the PDK Files in the resources (Upload
design.ngspice) - Libraries - Which you will also get from the PDK Files in the resources (Upload
sm141064.ngspice)
Complete the process by clicking "Save Circuit".
DC Analysis
After uploading the circuit, click on the testbench from the left-hand panel under Circuits.
(In this tutorial, two_stage_closed_DC is used.)
The following tabs will be visible:
- Netlist
- Design Parameters
- Environment Parameters
- Measurements
- Simulation Setup
- Genie
- Analytics
Each tab is explained in the sections below.
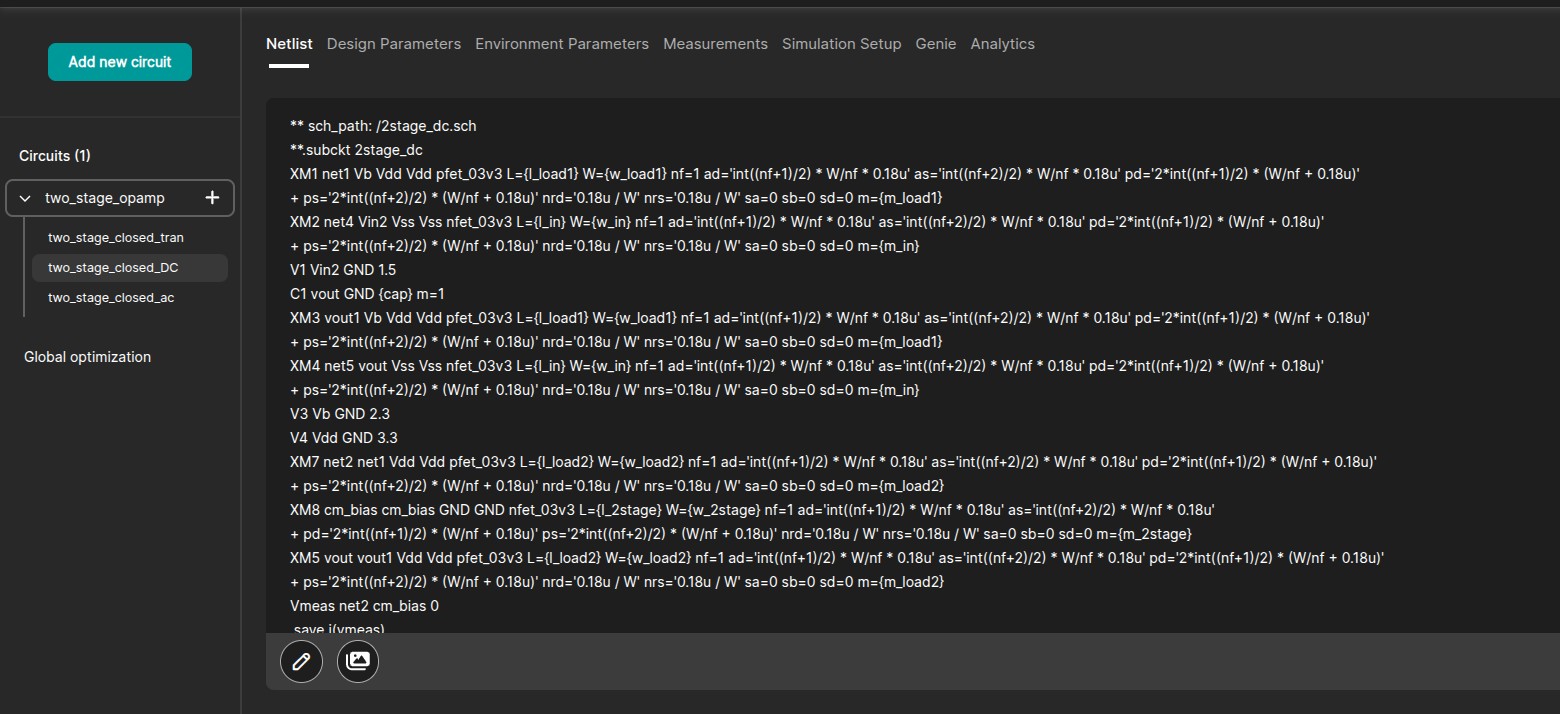
Netlist
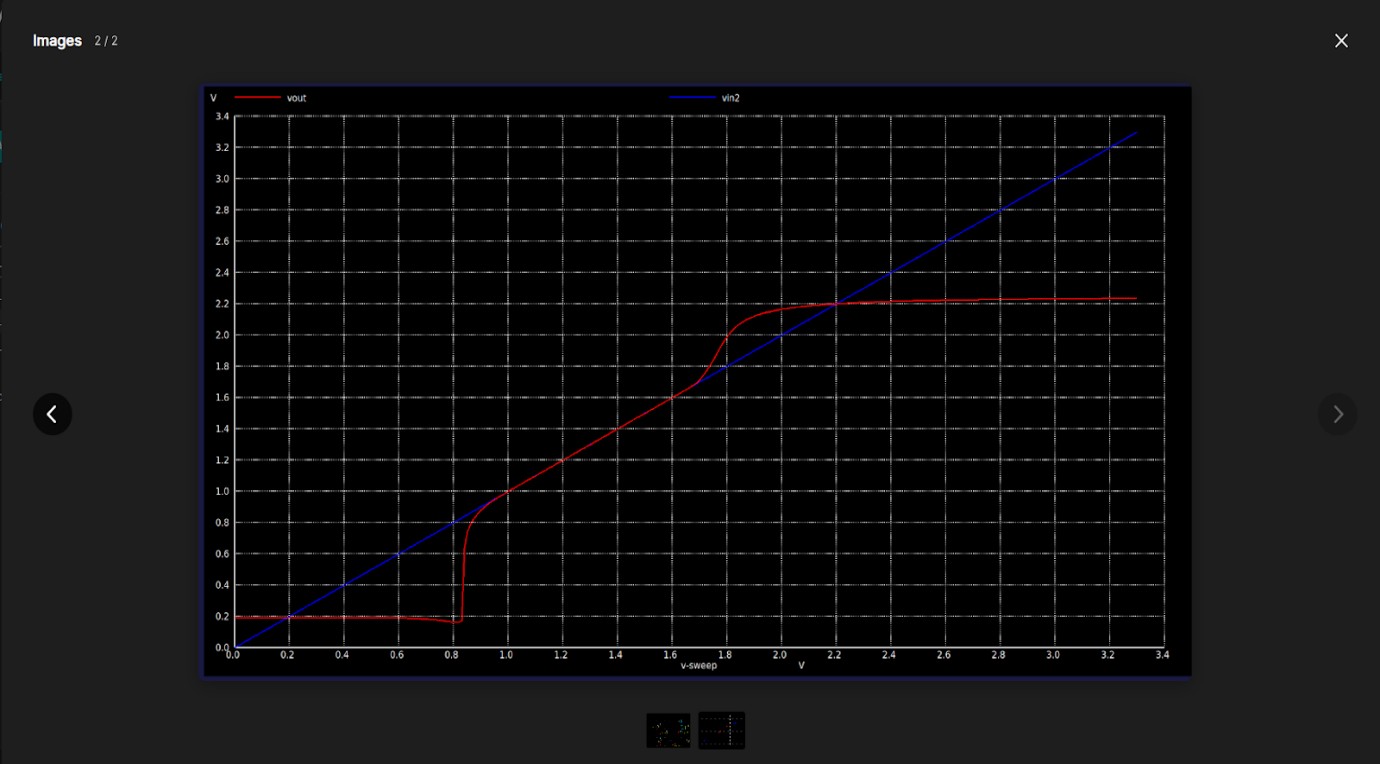
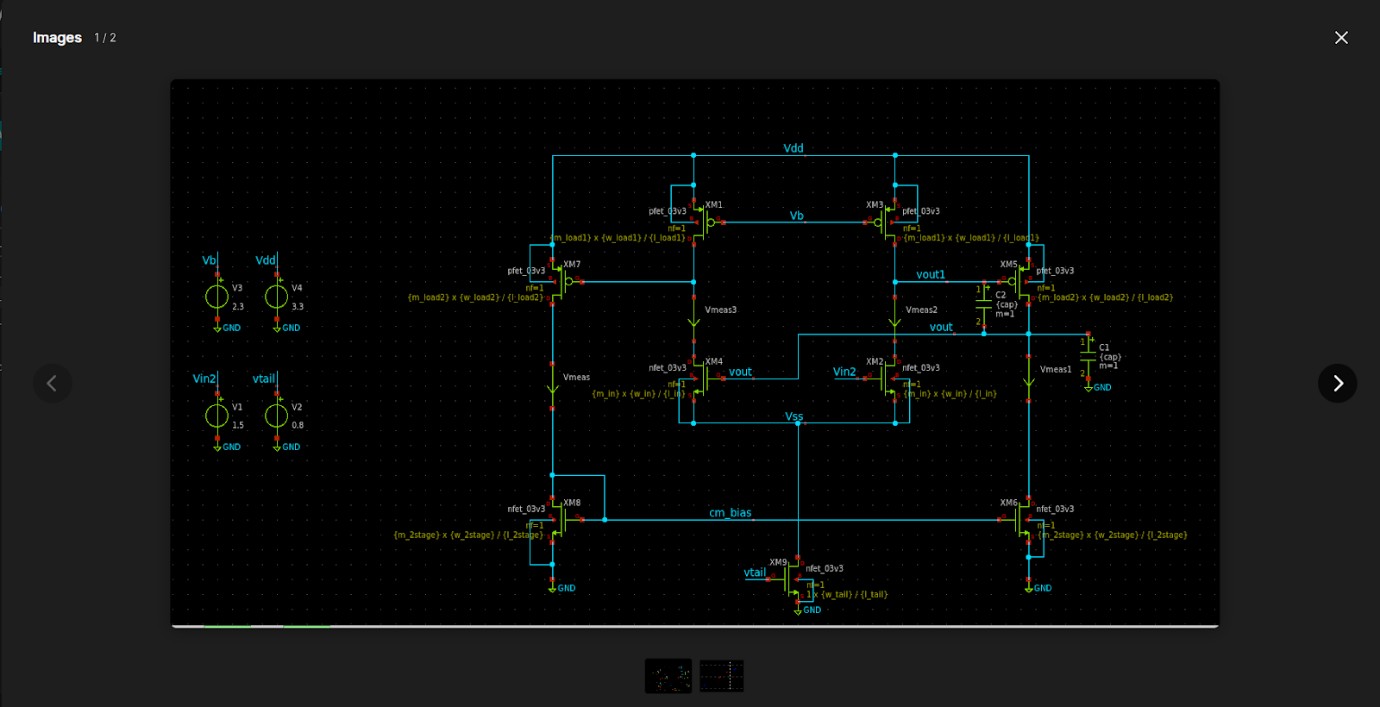
The Netlist tab displays the uploaded netlist file.
You can edit the netlist by clicking the Edit button, if changes are required for different simulation results.
Uploaded circuit images can be viewed by clicking the Image icon next to the Edit button.
Design Parameters
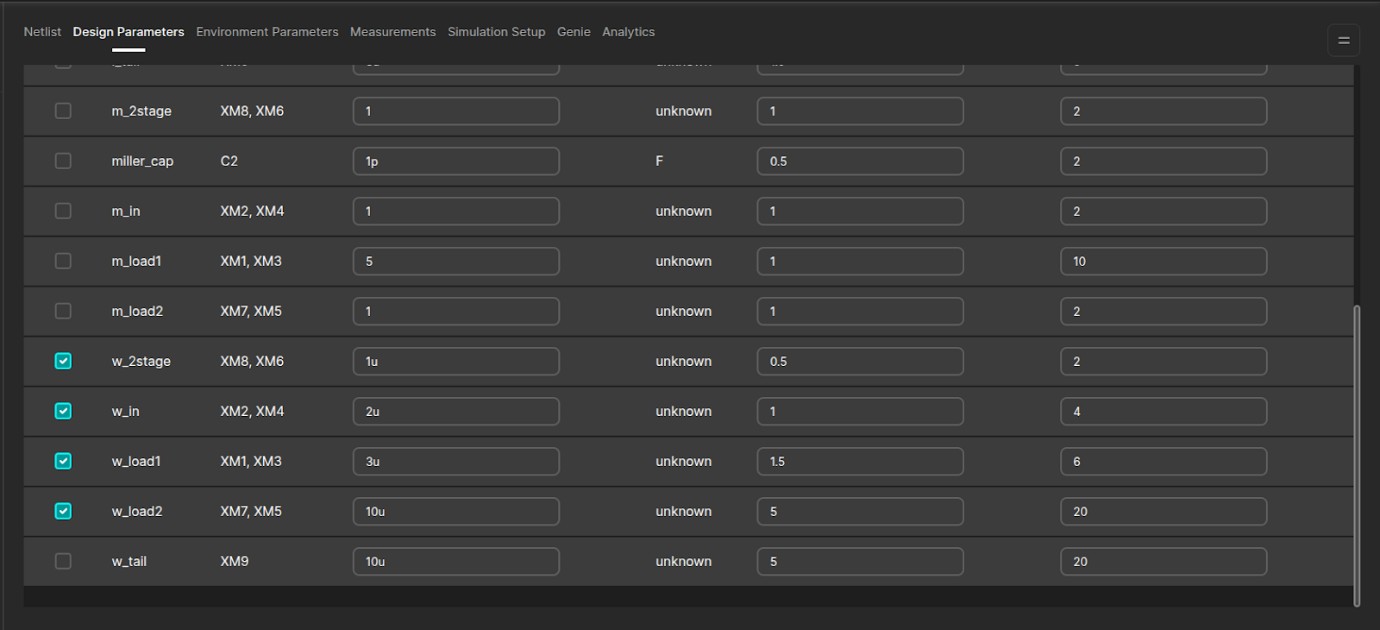
This tab displays all parameters defined in the uploaded netlist along with their current values.
For optimization purposes, you can specify a range for each parameter by modifying:
- Minimum Value
- Maximum Value
By default, these are set to half and twice the typical parameter value.
Select the testbench (two_stage_closed_DC) and enable the parameters that should be optimized by the AI agent.
Note: Design Parameter values can only be changed by accessing the Design Parameters tab from the Base Circuit page, not from the Design Parameters tab within the Test Bench Circuit page.
Environment Parameters
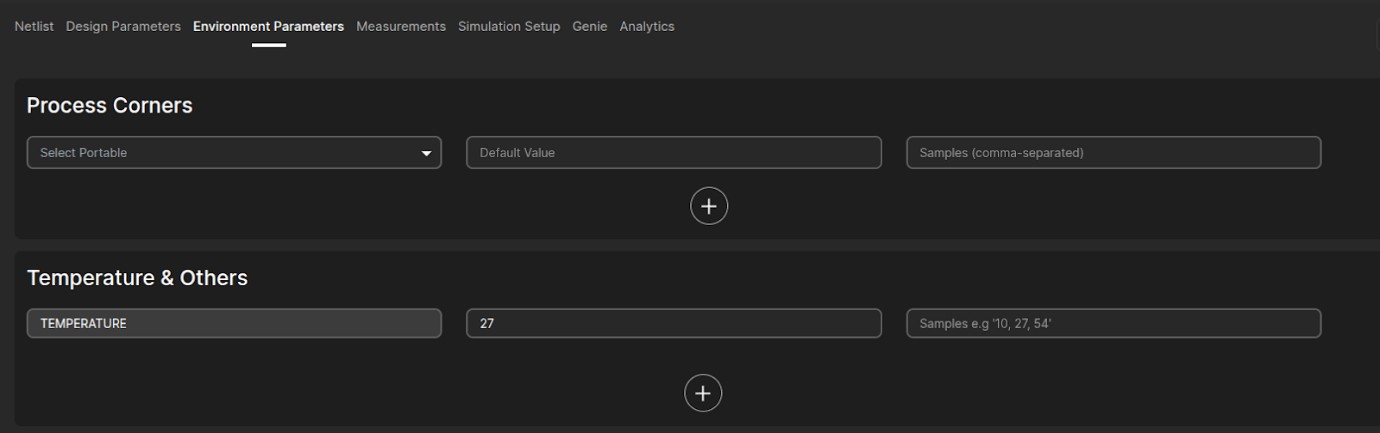
This tab is used to define simulation conditions such as:
- Process corner
- Temperature
For this tutorial, the temperature is set to a default value of 27°C.
Measurements
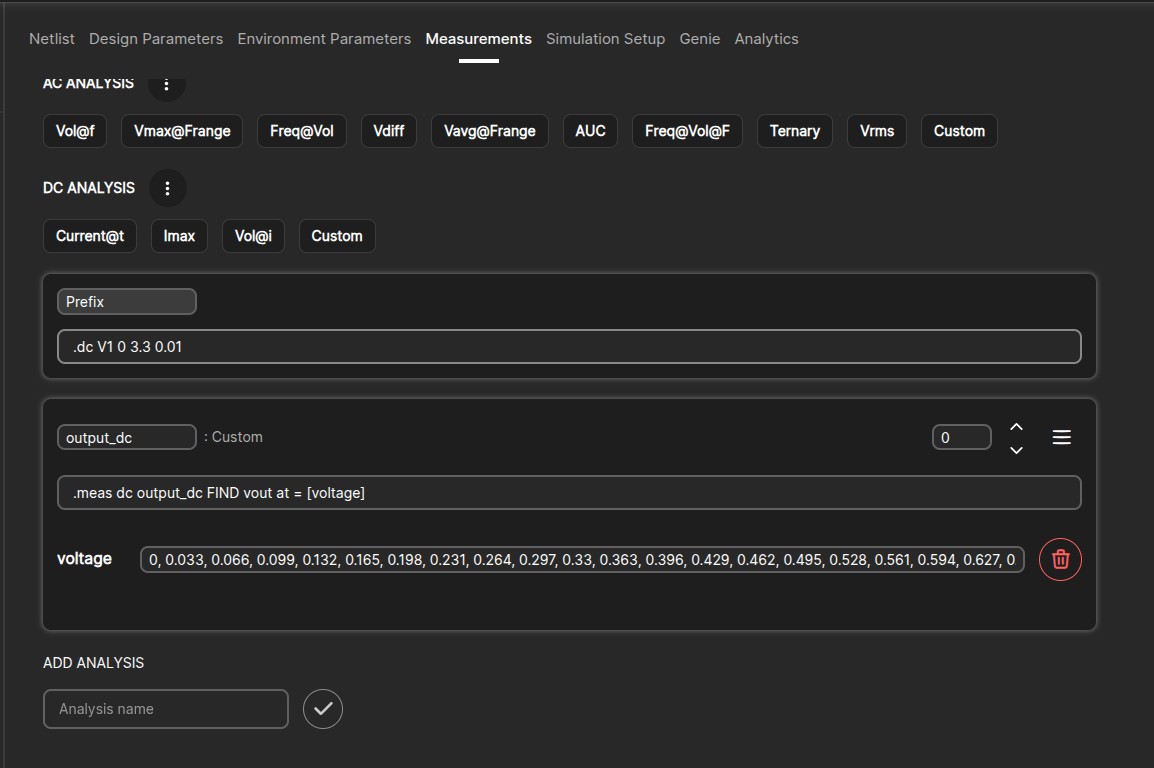
Measurement statements define what values should be evaluated during simulation.
The type of measurement depends on the requirement:
- Scalar
- Vector
Under DC Analysis, click the Custom button and provide a variable name.
Enter the measurement statement in the generated input box.
For this tutorial, a vector measurement is used to evaluate values at multiple instances.
Voltage values can be:
- Entered manually, or
- Uploaded using a CSV file via the menu icon beside DC Analysis.
Click the menu icon in the top-right corner of the measurement box and enable Vector Mode.
Provide:
- The variable name (e.g.,
[voltage]) - The instances at which measurements are taken, separated by commas
Data Capture
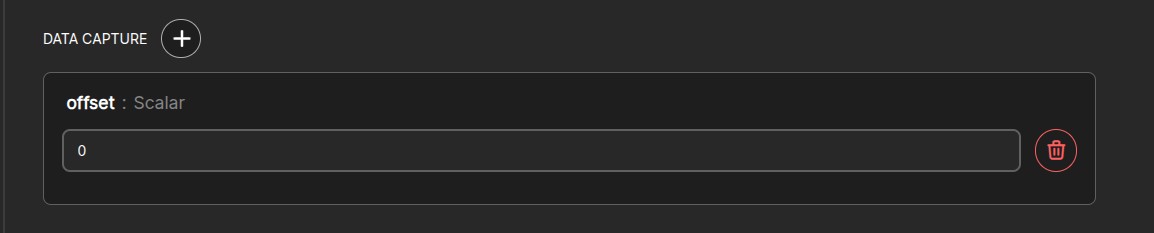
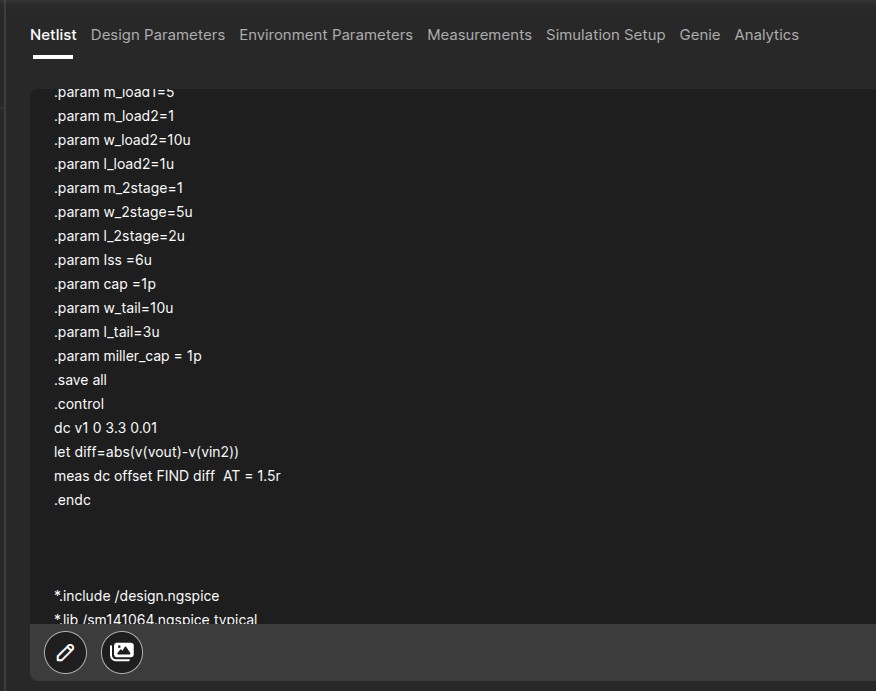
To extract variables defined within the netlist (such as offset), a Data Capture measurement is used.
This method is suitable for measurements involving let statements.
Click the Plus (+) icon under Data Capture.
Enter the variable name exactly as defined in the netlist (e.g., offset).
Vector measurements can also be used in Data Capture by:
- Changing the measurement type from Scalar to Vector
- Entering multiple variable names separated by commas
Simulation Setup
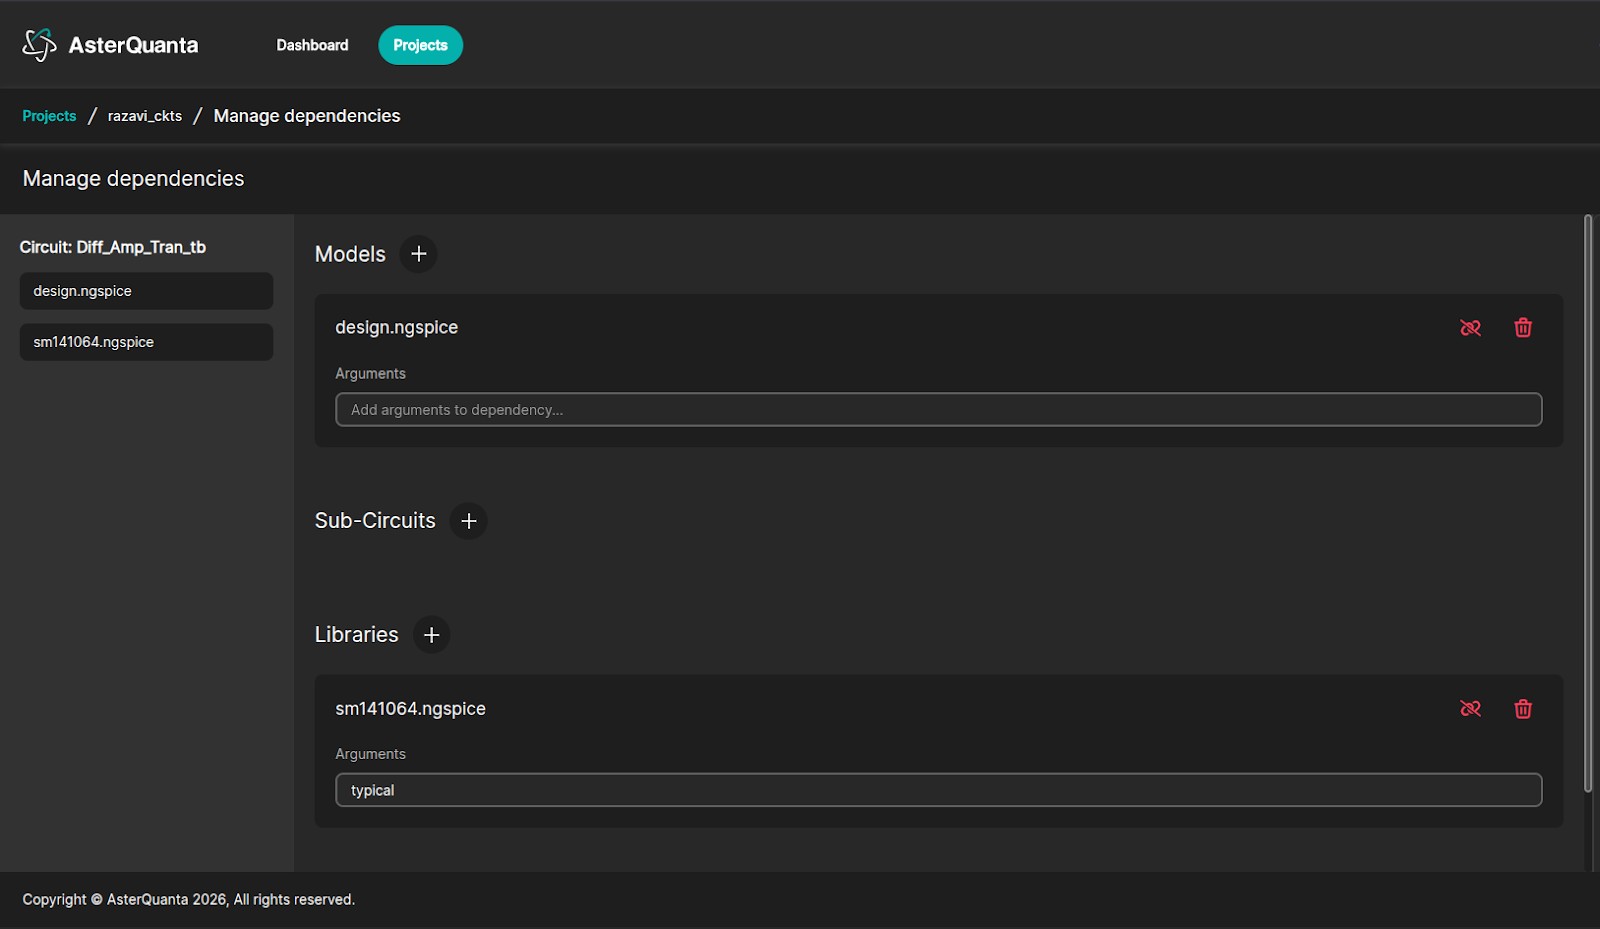
Manage Dependencies must be completed before running simulations.
Click the menu button below Publish Project (top-right corner).
Select Manage Dependencies, then click the Chain Icon to link the required models and libraries.
Once dependencies are connected, click Simulate.
Simulation results can be viewed in the Log file.

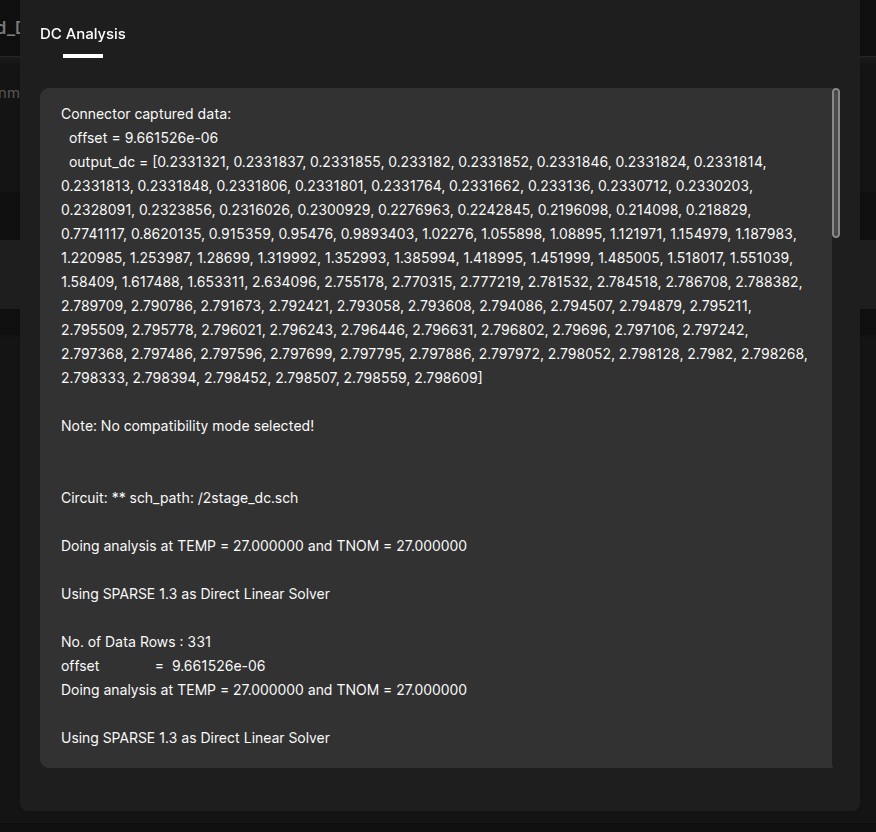
The results displayed correspond to the default design parameter values specified in the Design Parameters tab.
Genie (Optimization)
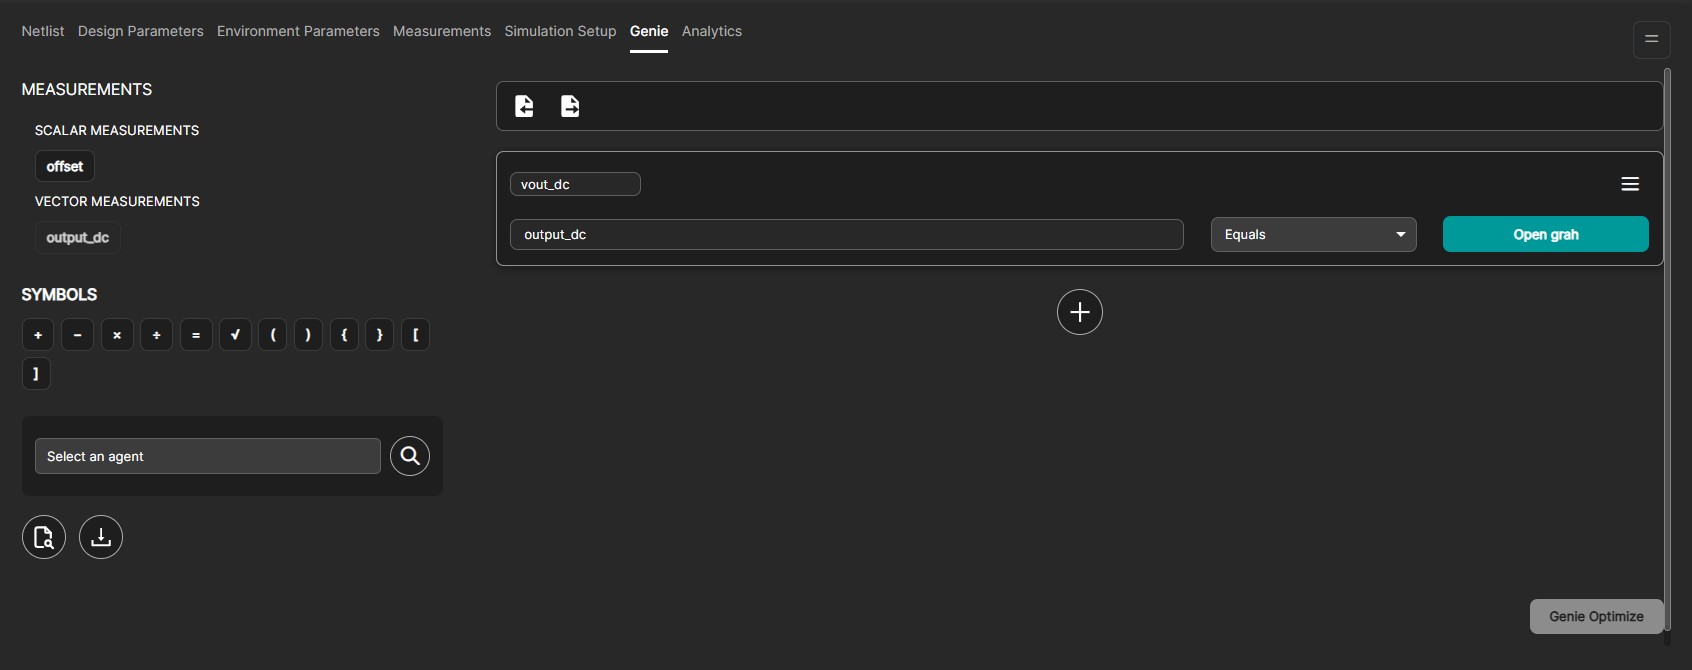
The Genie page is where circuit optimization is performed.
Measurement variables (both scalar and vector) defined earlier are displayed on the top-left of the Genie page.
You may rename expressions if required.
Click Enter Expression, select the measurement variable, and define the optimization goal:
- Minimum
- Maximum
- Range
- Equal to a value
Provide the target value or range for scalar measurements.
Multiple expressions can be added using the Plus (+) icon.
For vector measurements, targets can be assigned using Graph Mode, since optimization occurs across multiple instances.
Click Open Graph to assign vector targets.
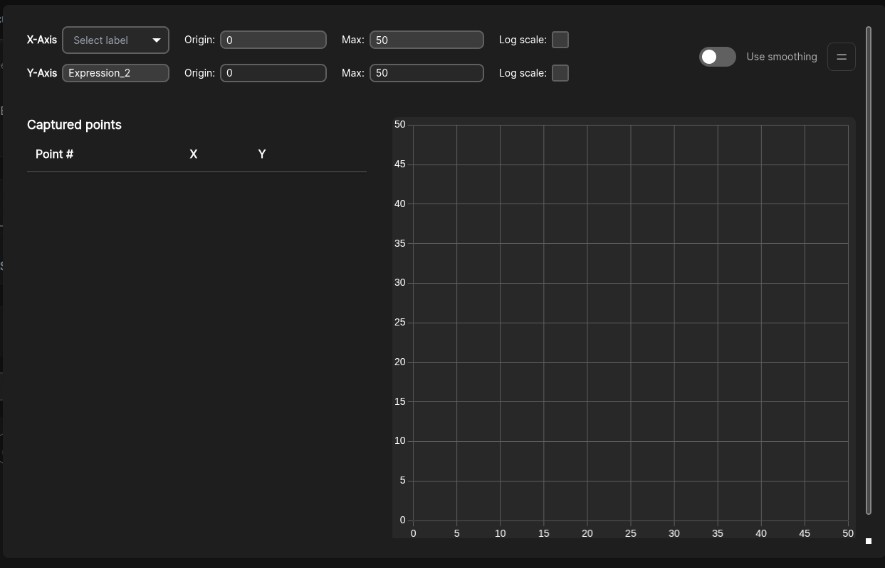
Select the X-axis label (e.g., output_dc).
The instances defined earlier will be listed automatically.
Set Y-values either:
- Manually (for a small number of points), or
- By uploading a CSV file (for larger datasets)
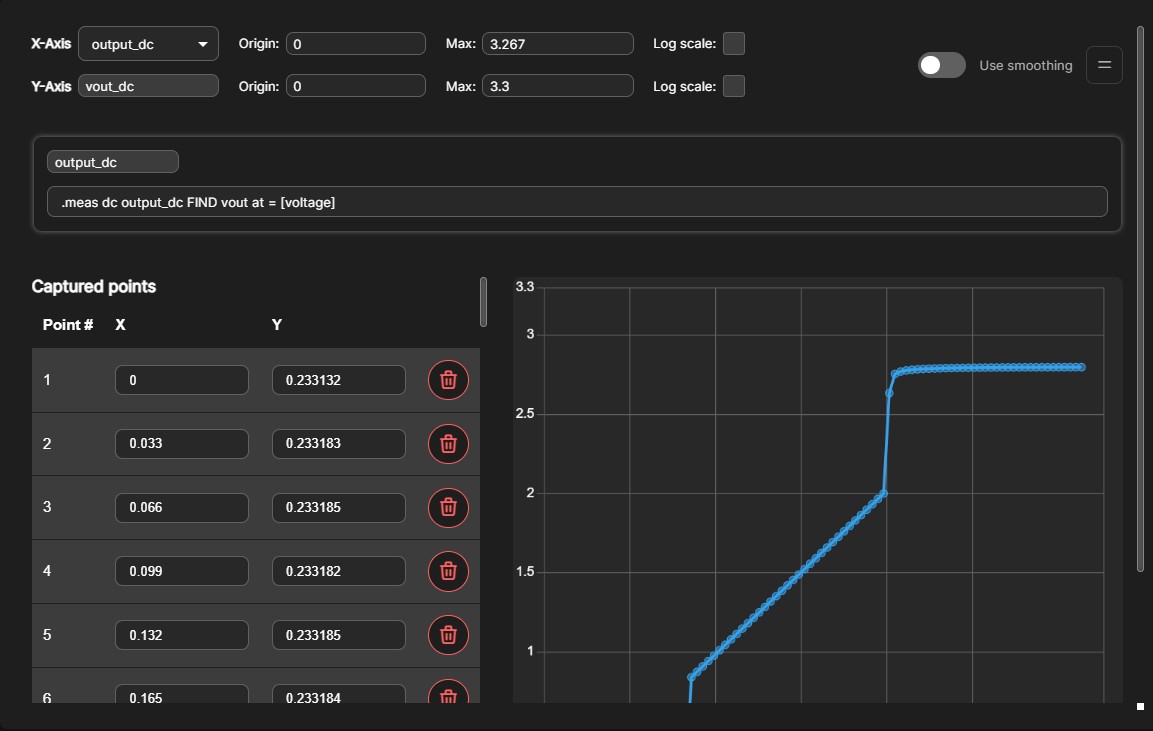
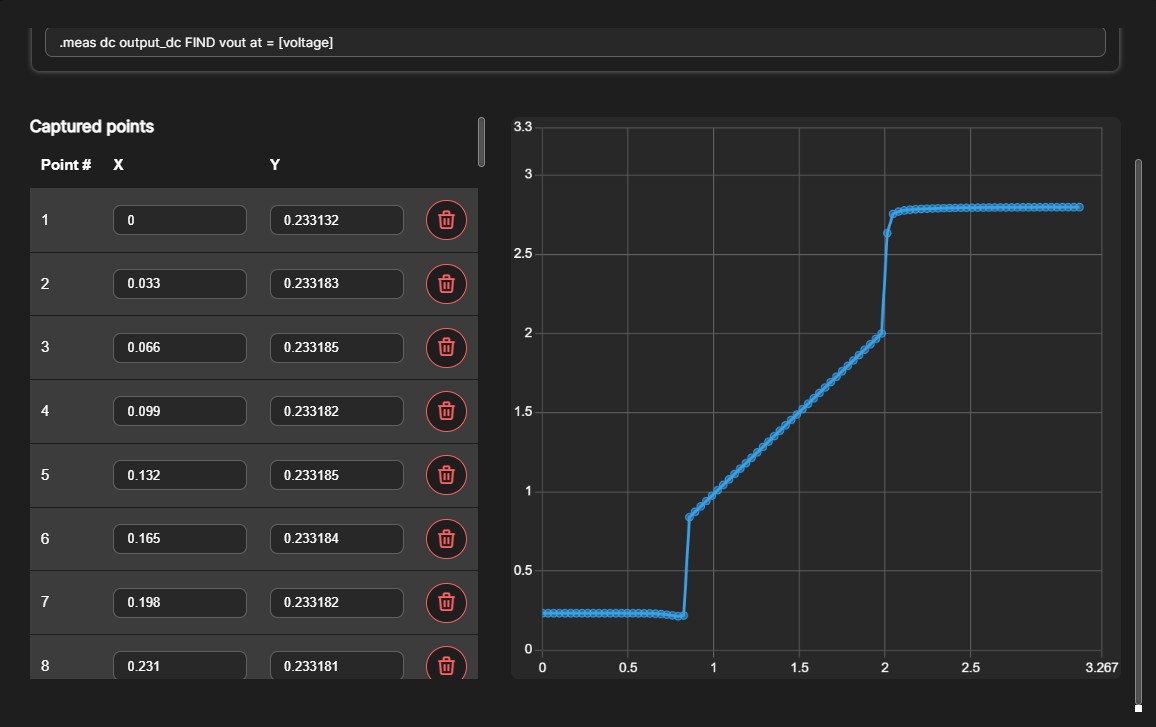 Targets can also be assigned by importing a JSON file using the Import from File option.
The required JSON files are available in the Resources section of this document.
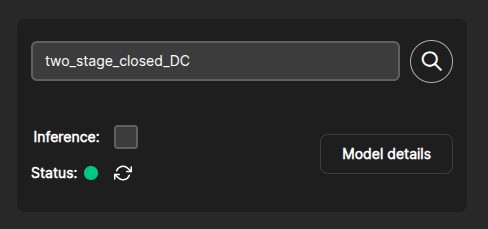
On the bottom left of the Genie page, you can select the appropriate agent for optimization.
(For this tutorial, two_stage_closed_dc is used.)
Click Genie Optimize at the bottom-right of the page.
Open the Chart view to monitor:
- Current iteration measurement
- Best measurement achieved
- Target value
Each optimization iteration is displayed in real time.
Previous iterations can be viewed by enabling Show Trail.
Once the target is achieved, download the optimized netlist by clicking the Download icon below the agent selection panel.
Transient Analysis
After uploading the circuit, add a new testbench by clicking the Plus (+) icon.
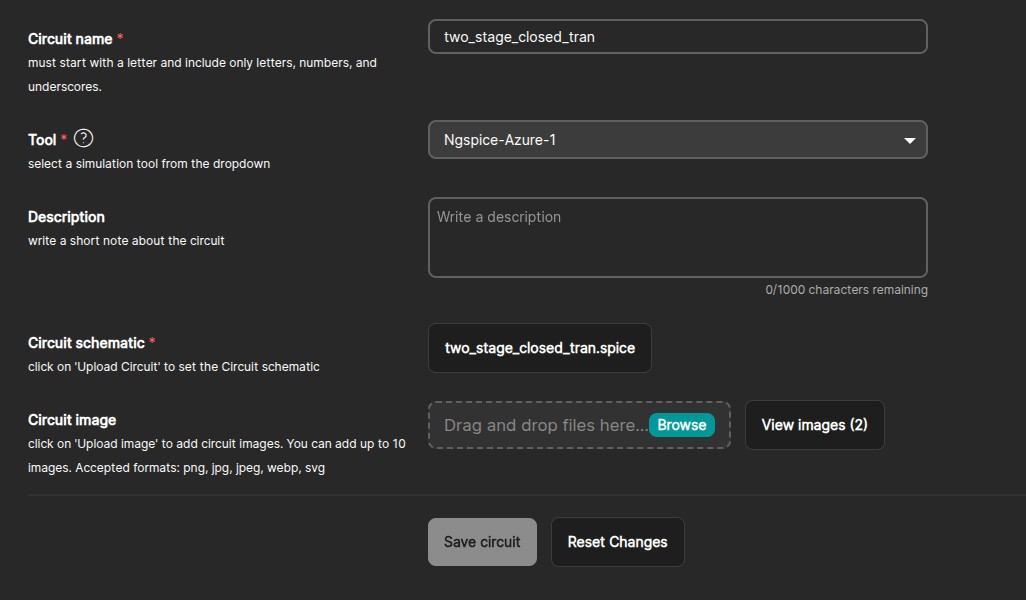
Upload the required .spice file along with the waveform images for the analysis, then click Save Circuit.
Once saved, click on the newly created testbench. The following tabs will be available:
- Netlist
- Design Parameters
- Measurements
- Simulation Setup
- Genie
- Analytics
Each tab is explained in the sections below.
Netlist
The Netlist tab displays the uploaded netlist file.
You can edit the netlist by clicking the Pencil (Edit) icon, if changes are required for different simulation results.
Uploaded circuit images can be viewed by clicking the Image icon next to the Edit icon.
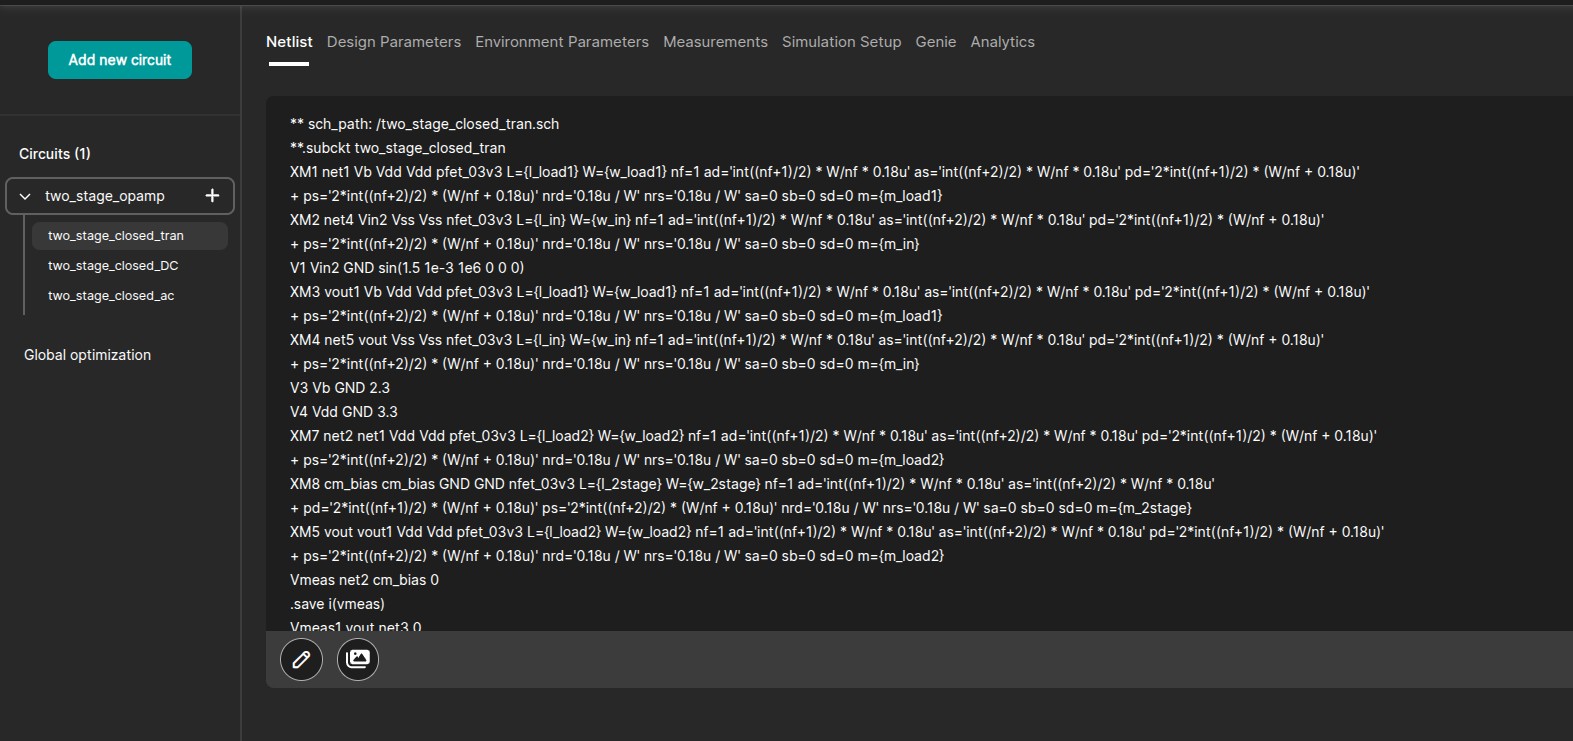
The images uploaded for the transient analysis are shown below:
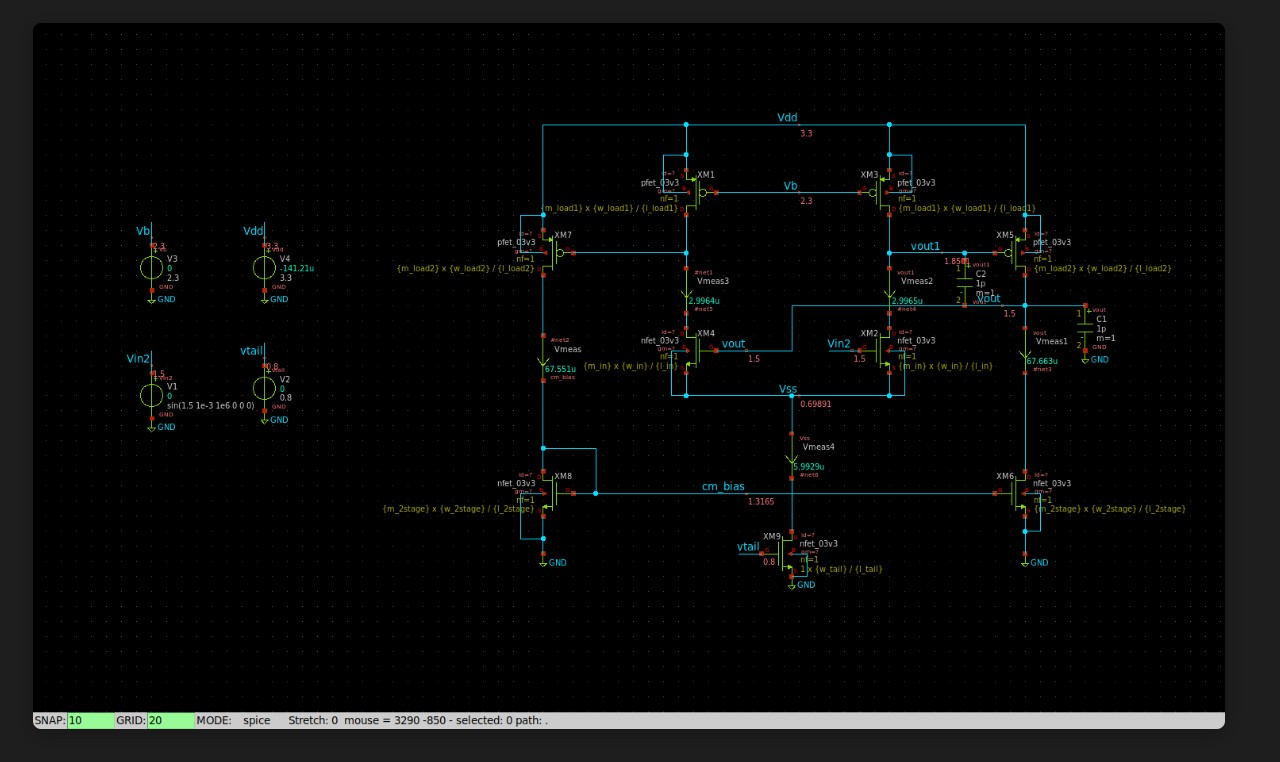
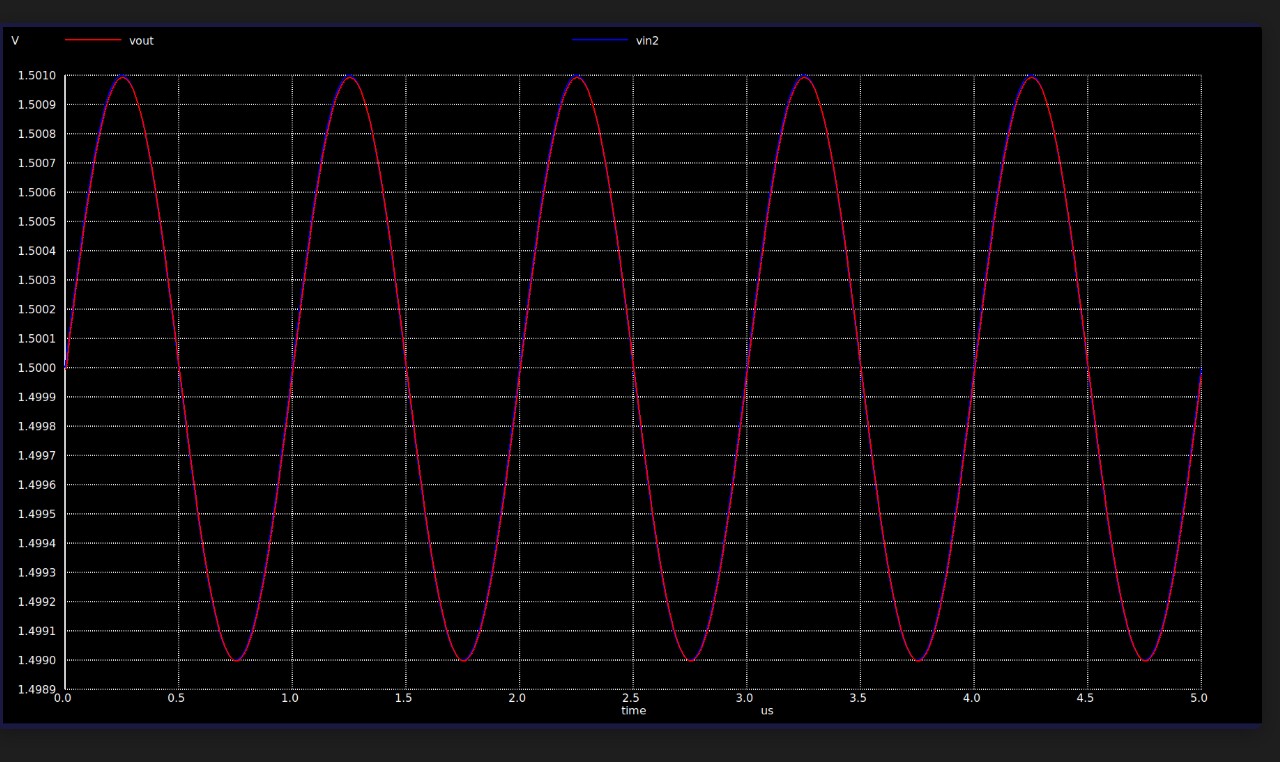
Design Parameters
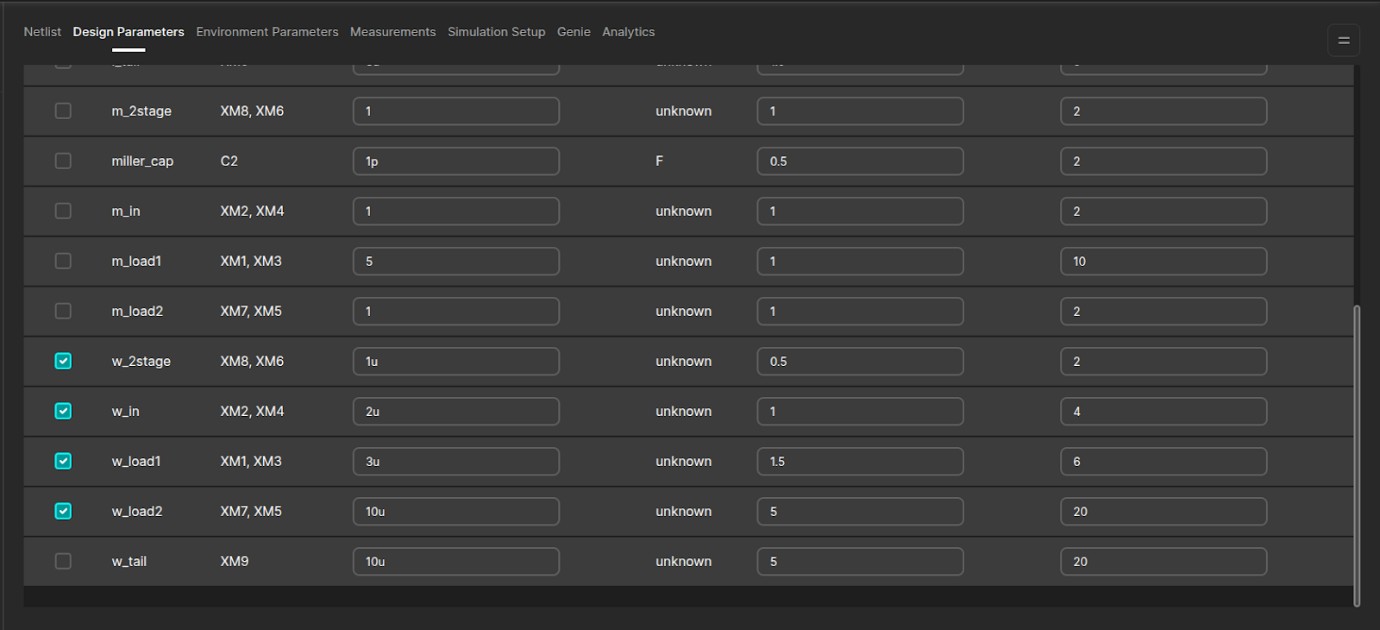
This tab displays all parameters defined in the uploaded netlist along with their current values.
For optimization, you can select the parameters that the AI agent is allowed to modify.
You can also define the allowed range of each parameter by adjusting:
- Minimum Value
- Maximum Value
By default, these are set to half and twice the typical parameter value.
Measurements
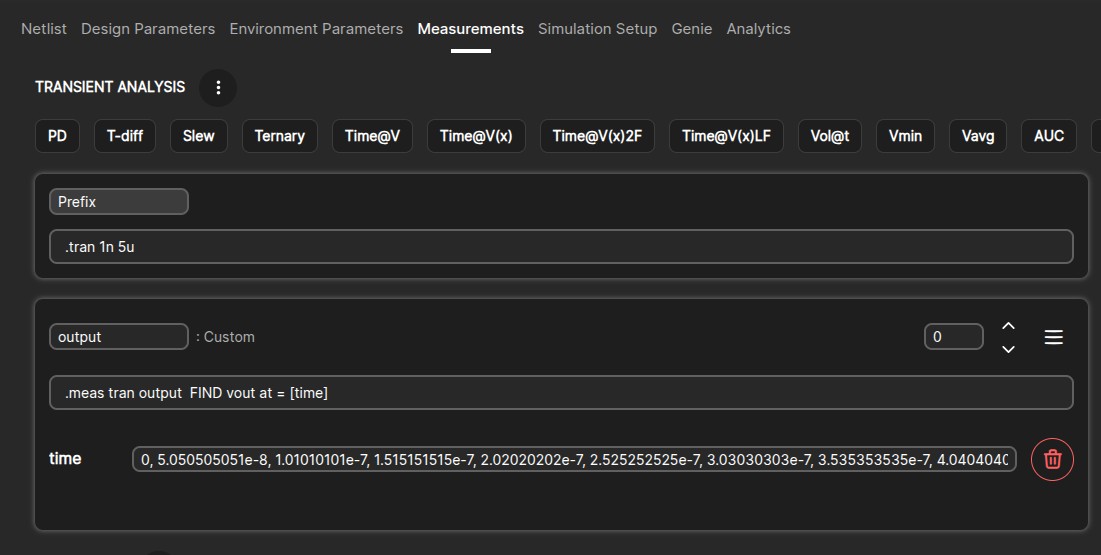
Measurement statements define the values that will be evaluated during simulation.
The measurement type depends on the requirement:
- Scalar
- Vector
Under Transient Analysis, click the Custom button and provide a variable name.
Enter the measurement statement in the generated input box.
For this tutorial, a vector measurement is used to evaluate values at multiple instances.
The required voltage/time values can be:
- Entered manually, or
- Uploaded using a CSV file (via the menu icon beside Transient Analysis)
To enable vector measurement:
- Click the menu icon in the top-right corner of the measurement box
- Enable Vector Mode
- Provide:
- The variable name (e.g.,
[time]) - The instances at which measurements are taken, separated by commas
- The variable name (e.g.,
Simulation Setup
This tab displays the results of the measurement statements added under the Measurements tab.
Before running the simulation, Manage Dependencies must be completed.
To add dependencies:
- Click the menu button below Publish Project (top-right corner)
- Select Manage Dependencies
- Click the Chain icon to connect the required models and libraries
After linking dependencies:
- Click Simulate
- View the results in the Log file
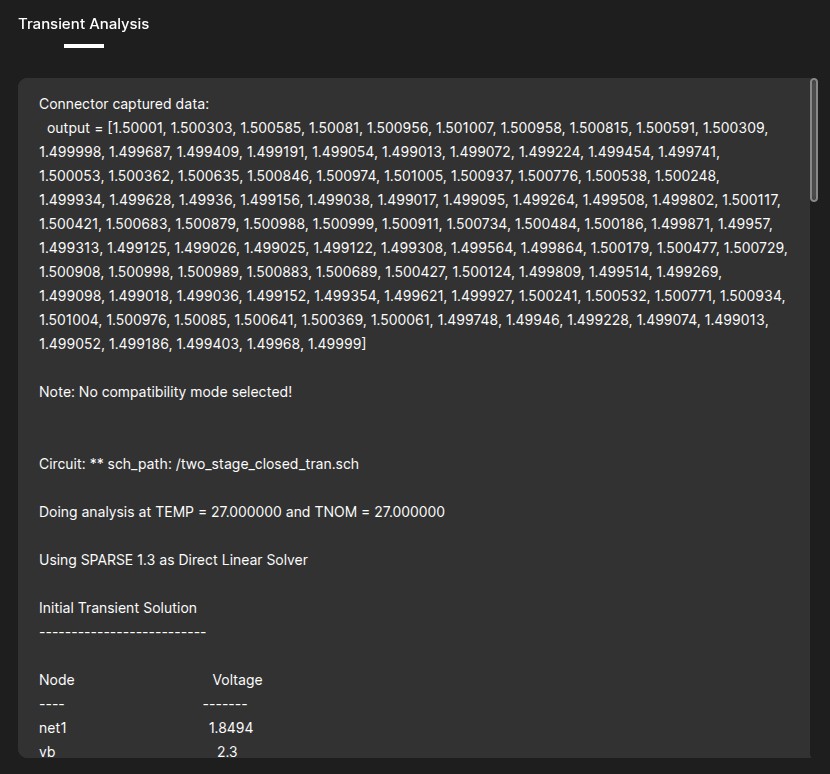
Genie (Optimization)
This page is where circuit optimization is performed, and targets are assigned for the AI agent to achieve.
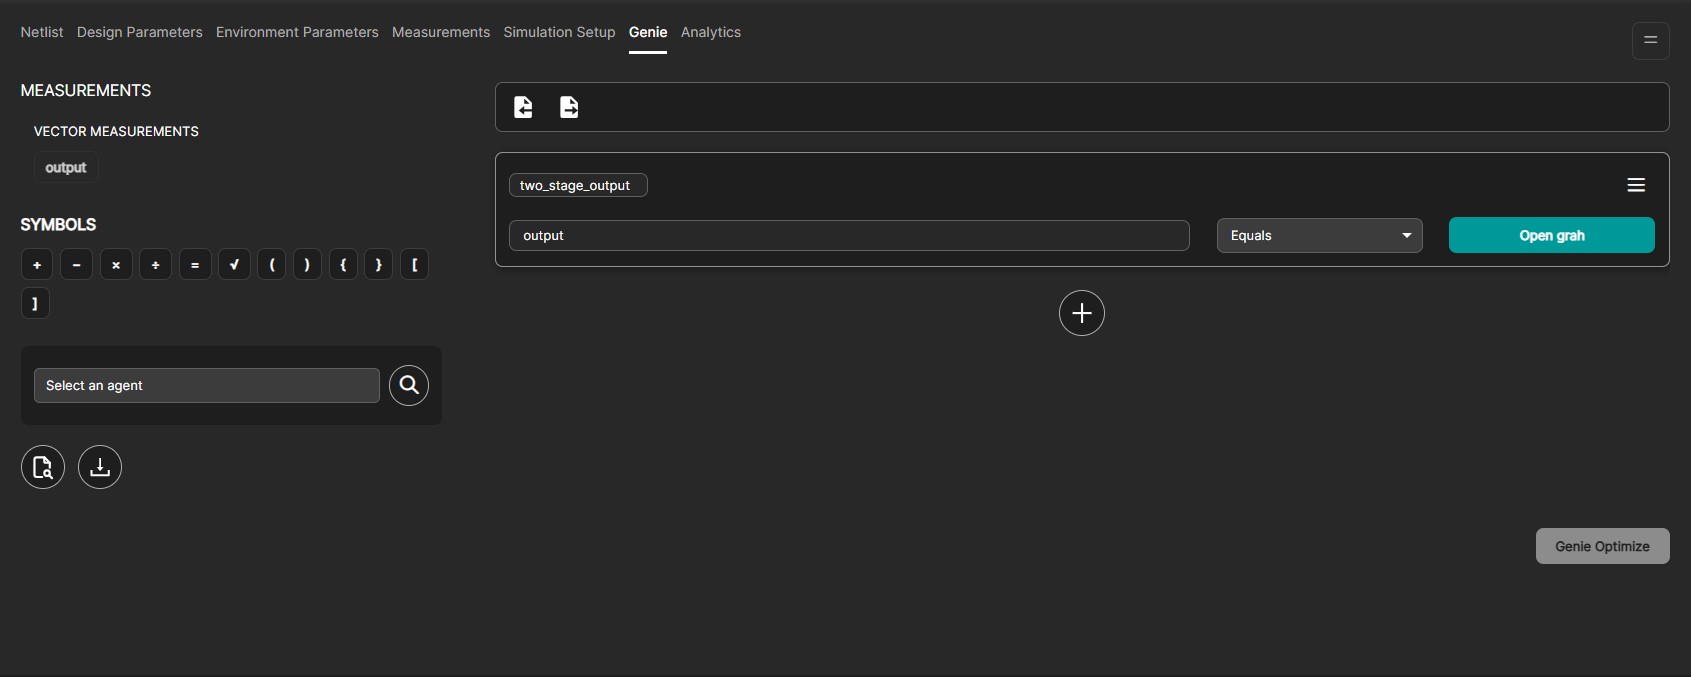
All measurement variables (both scalar and vector) defined earlier will be displayed on the top-left of the Genie page.
You may rename expressions if required.
To configure optimization:
- Click Enter Expression
- Select the measurement variable
- Define the optimization goal:
- Minimum
- Maximum
- Range
- Equal to a value
- Provide the target value/range (for scalar measurements)
Multiple expressions can be added using the Plus (+) icon.
For vector measurements, targets can be assigned using Graph Mode, since optimization occurs across multiple instances.
Click Open Graph to assign vector targets.
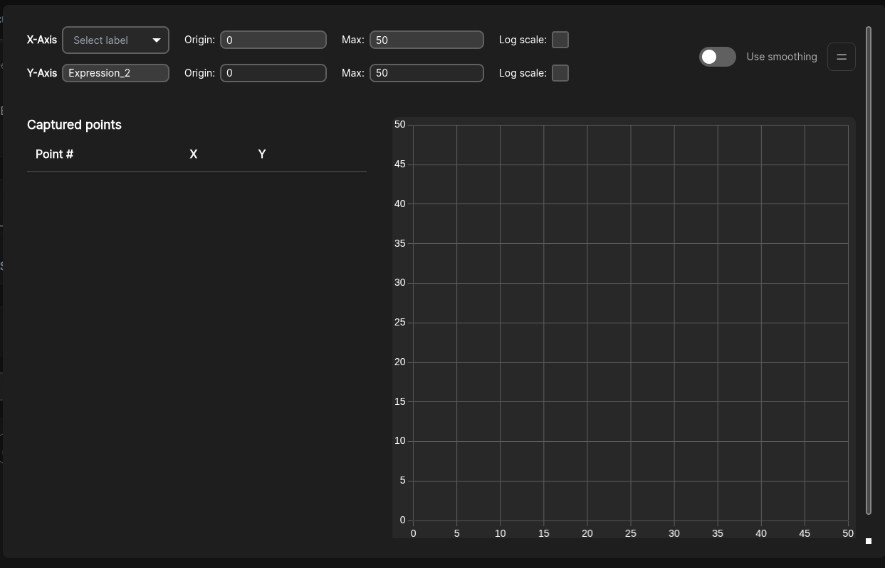
Select the X-axis label (e.g., output). The instances entered in the Measurements tab will be listed automatically.
Targets (Y-values) can be set:
- Manually (for a small number of points), or
- By uploading a CSV file (for larger datasets)
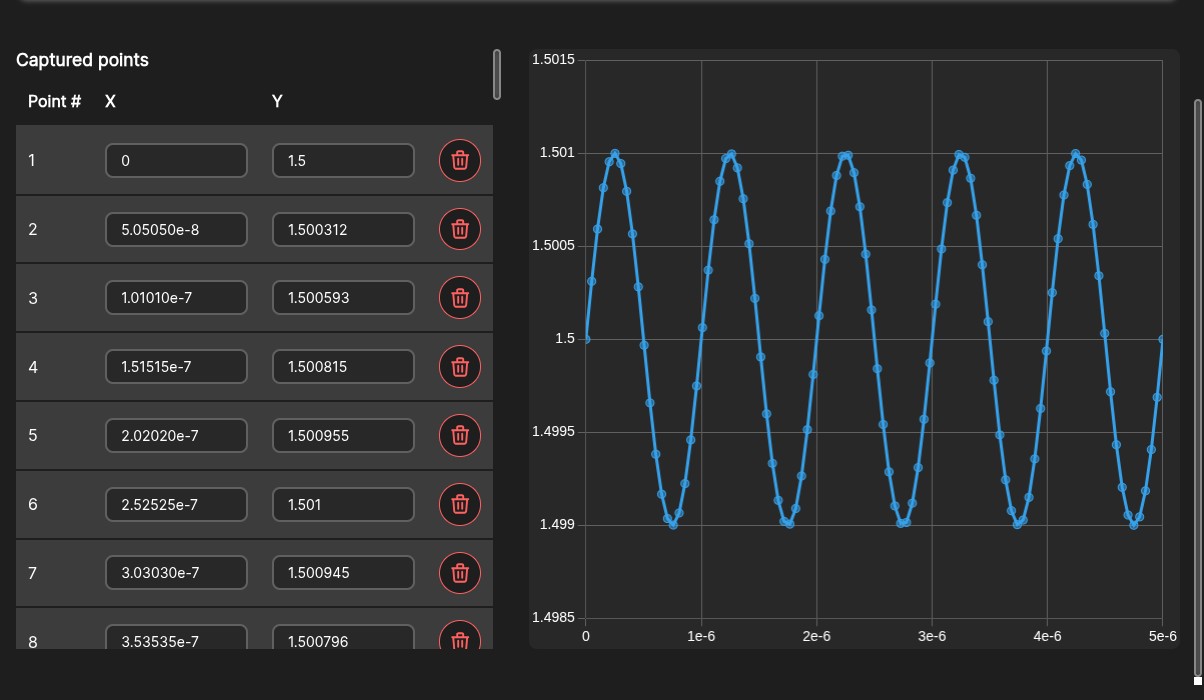
Targets can also be assigned by importing a JSON file using Import from File.
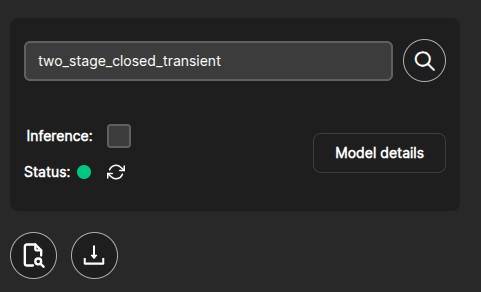
On the bottom left of the Genie page, you can select the appropriate agent for optimization. For this tutorial, the agent two_stage_closed_transient is used.
Then click Genie Optimize at the bottom-right of the Genie page.
Open the Chart view to monitor:
- Current iteration measurement
- Best measurement achieved
- Target value
Each optimization iteration is displayed in real time. Previous iterations can be viewed by enabling Show Trail.
Once the target is achieved, download the optimized netlist by clicking the Download icon below the agent selection panel.
AC Analysis
Add a new testbench by clicking the Plus (+) icon.
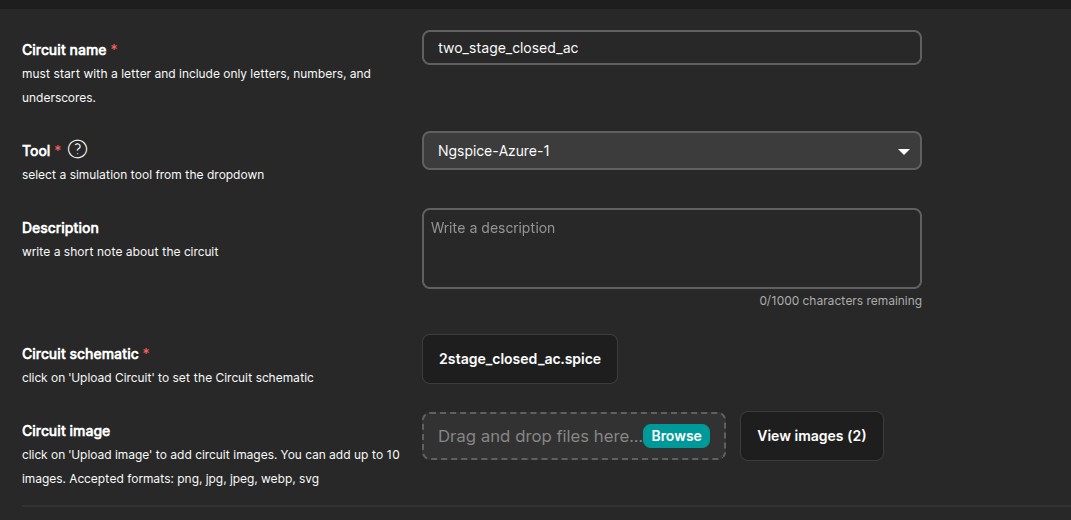
Upload the required .spice file along with the waveform images, then click Save Circuit.
After uploading, click on the testbench. The following tabs will be visible:
- Netlist
- Design Parameters
- Measurements
- Simulation Setup
- Genie
- Analytics
Each tab is explained in the sections below.
Netlist
The Netlist tab displays the uploaded netlist file.
You can edit the netlist by clicking the Pencil (Edit) icon, if changes are required for different simulation results.
Uploaded circuit images can be viewed by clicking the Image icon next to the Edit icon.
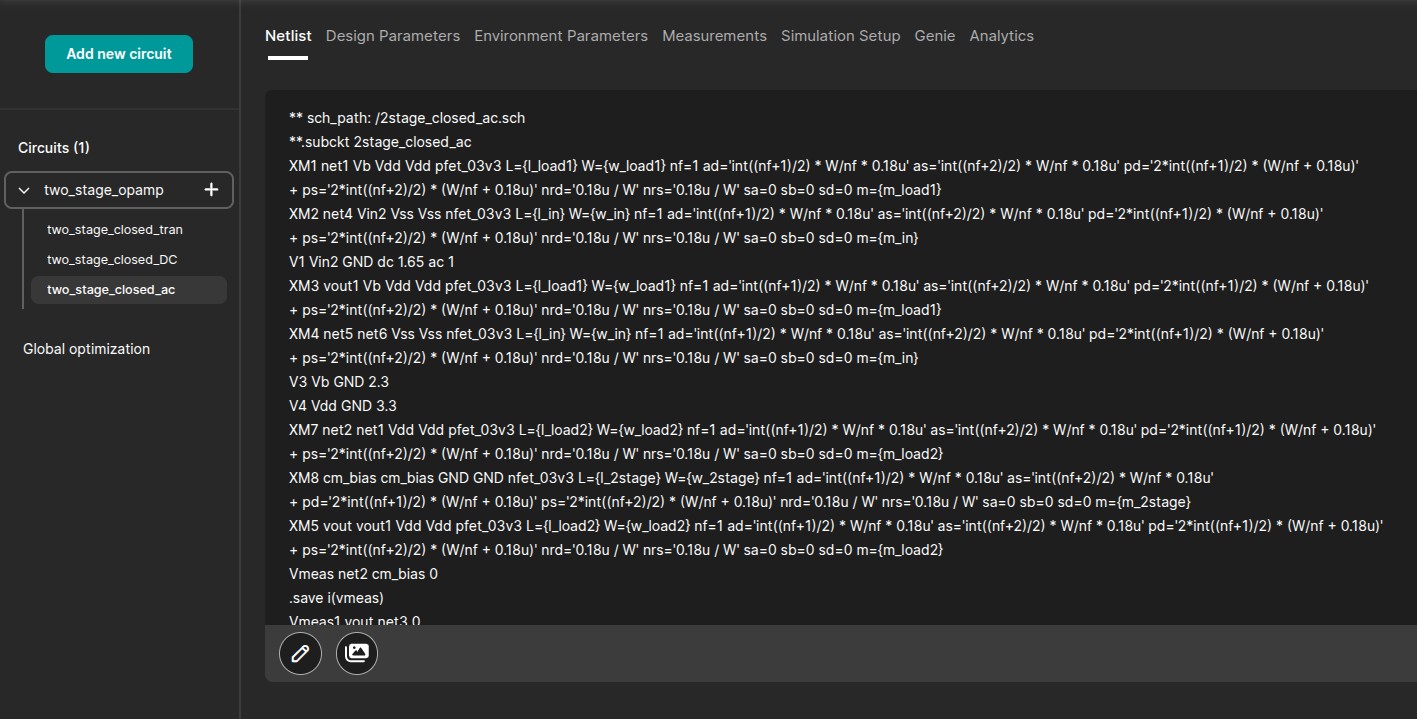
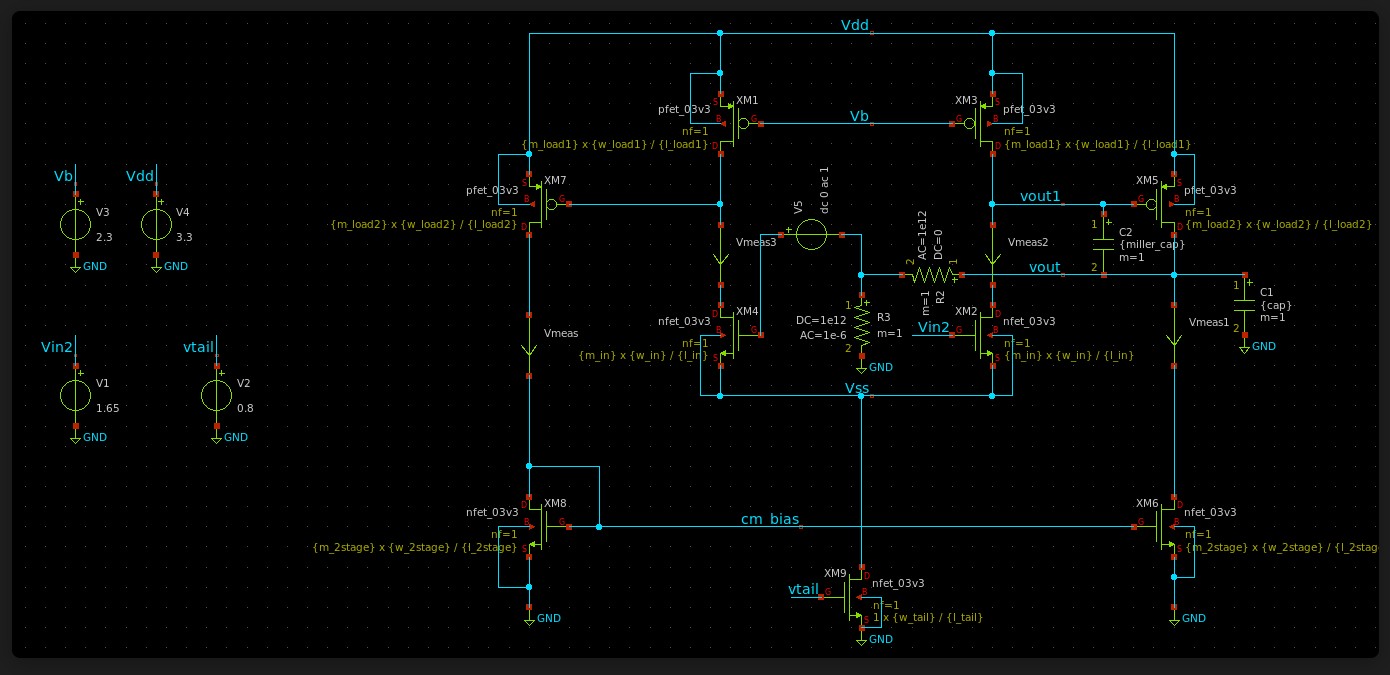
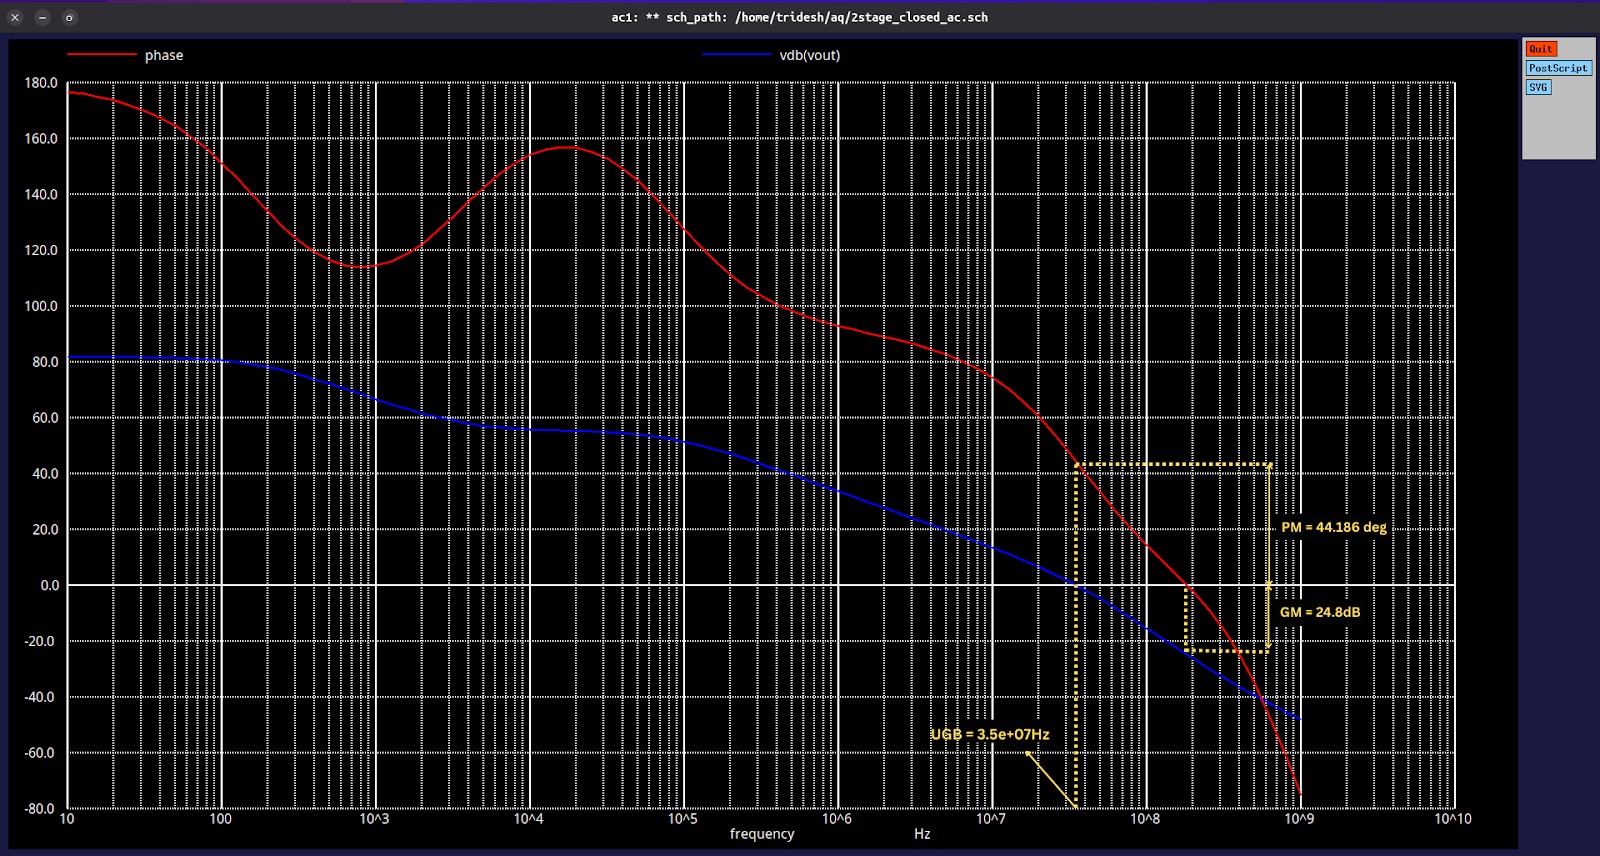
The images uploaded for the AC analysis are shown below:
Design Parameters
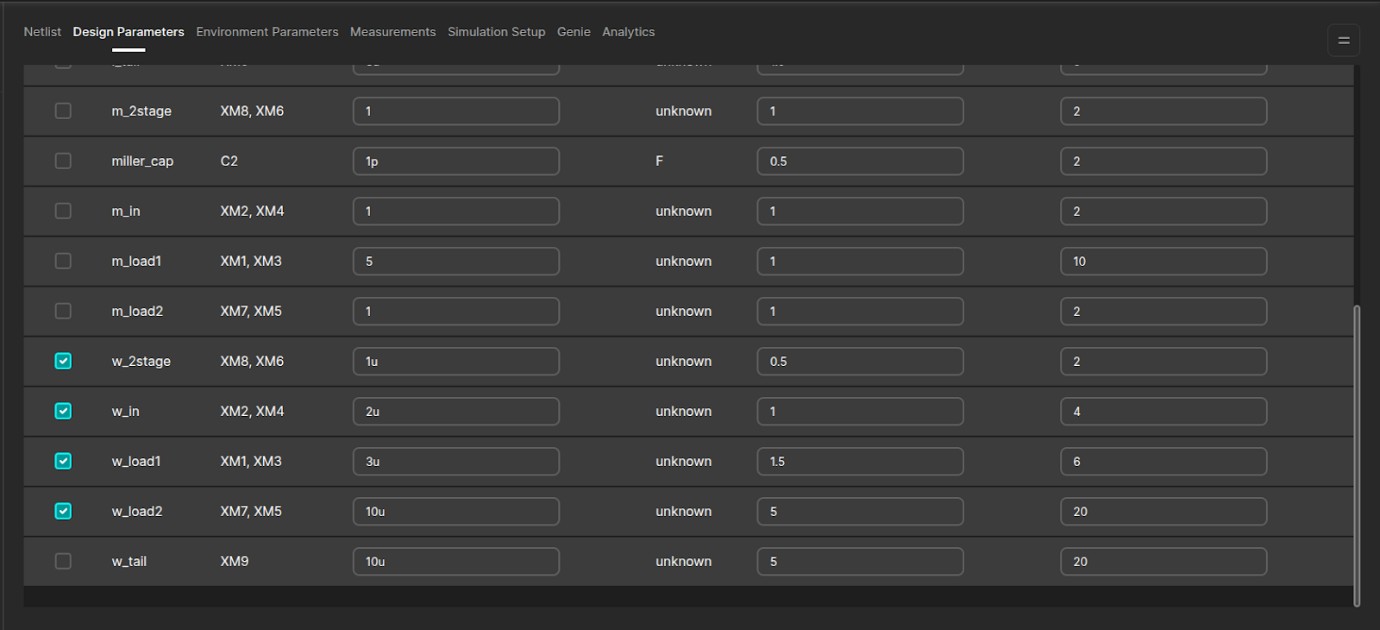
This tab displays all parameters defined in the uploaded netlist along with their current values.
For optimization, select the parameters that the AI agent is allowed to modify.
For each enabled parameter, specify its optimization range by adjusting:
- Minimum Value
- Maximum Value
By default, these values are set to half and twice the typical parameter value.
Measurements
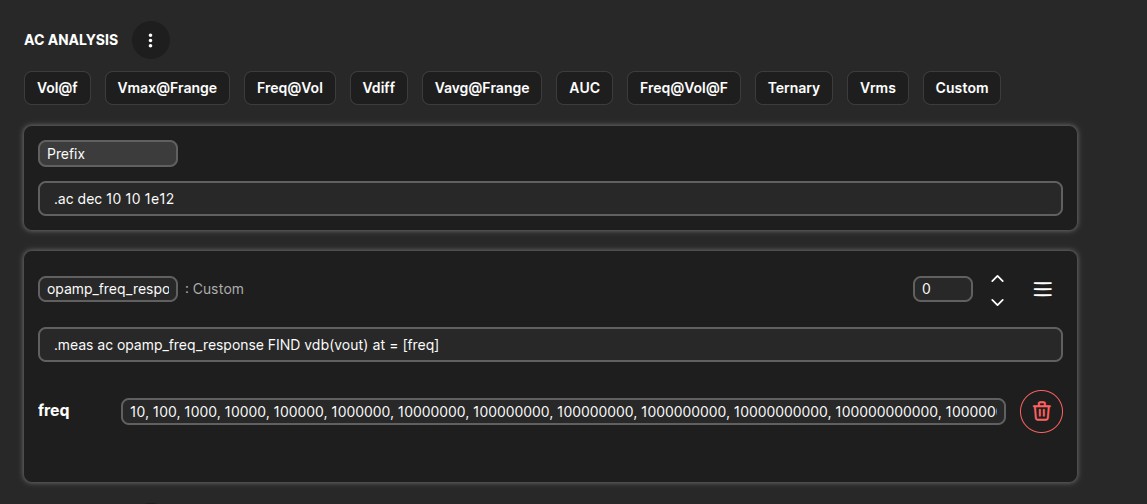
Measurement statements define the values that will be evaluated during simulation.
The measurement type depends on the requirement:
- Scalar
- Vector
Under AC Analysis, click the Custom button and provide a variable name.
Enter the measurement statement in the generated input box.
For this tutorial, a vector measurement is used to evaluate values at multiple frequency instances.
The required values can be:
- Entered manually, or
- Uploaded using a CSV file (via the menu icon beside AC Analysis)
To enable vector measurement:
- Click the menu icon in the top-right corner of the measurement box
- Enable Vector Mode
- Provide:
- The variable name (e.g.,
[freq]) - The frequency instances separated by commas
- The variable name (e.g.,
Data Capture
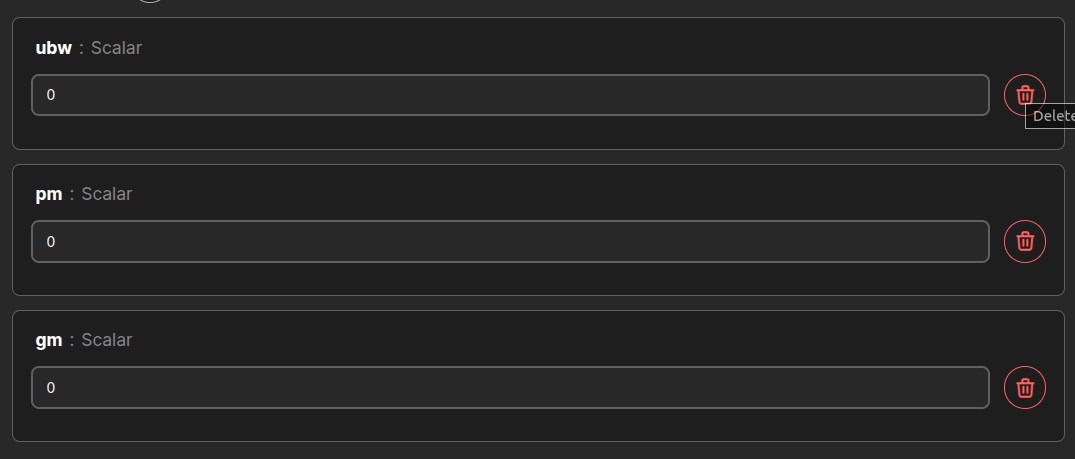
To extract variables directly from the netlist, a Data Capture measurement is used.
This method is suitable for measurements involving let statements.
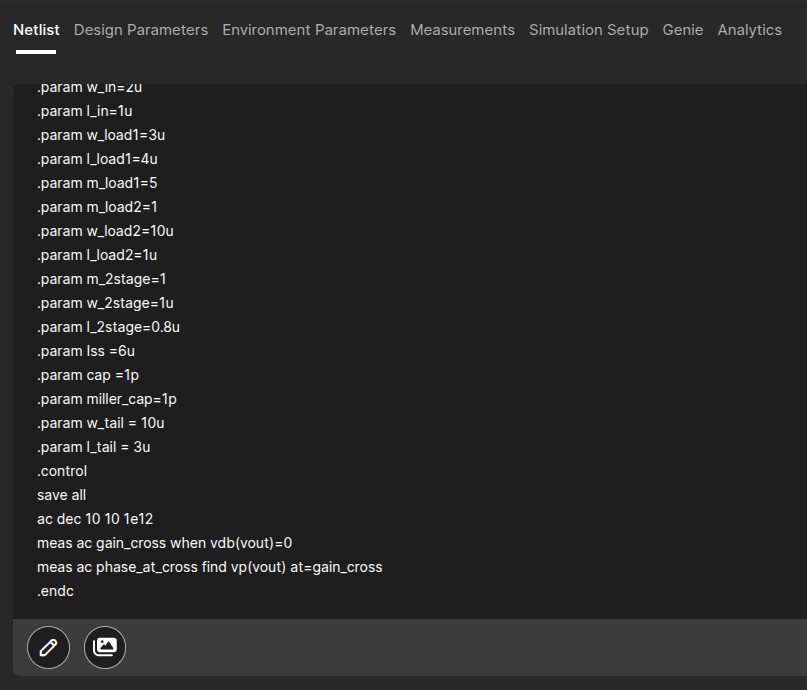
In this tutorial, the variables ubw and pm are calculated using let statements. Therefore, Data Capture is used.
To add a Data Capture measurement:
- Click the Plus (+) icon under Data Capture
- Enter the variable name exactly as defined in the netlist
Vector measurements can also be used in Data Capture by:
- Changing the measurement type from Scalar to Vector
- Entering multiple variable names separated by commas
Simulation Setup
This tab displays the results of the measurement statements added under the Measurements tab.
Before running the simulation, Manage Dependencies must be completed.
To include dependencies:
- Click the menu button below Publish Project (top-right corner)
- Select Manage Dependencies
- Click the Chain icon to connect the required models and libraries
After linking dependencies:
- Click Simulate
- View the results in the Log file
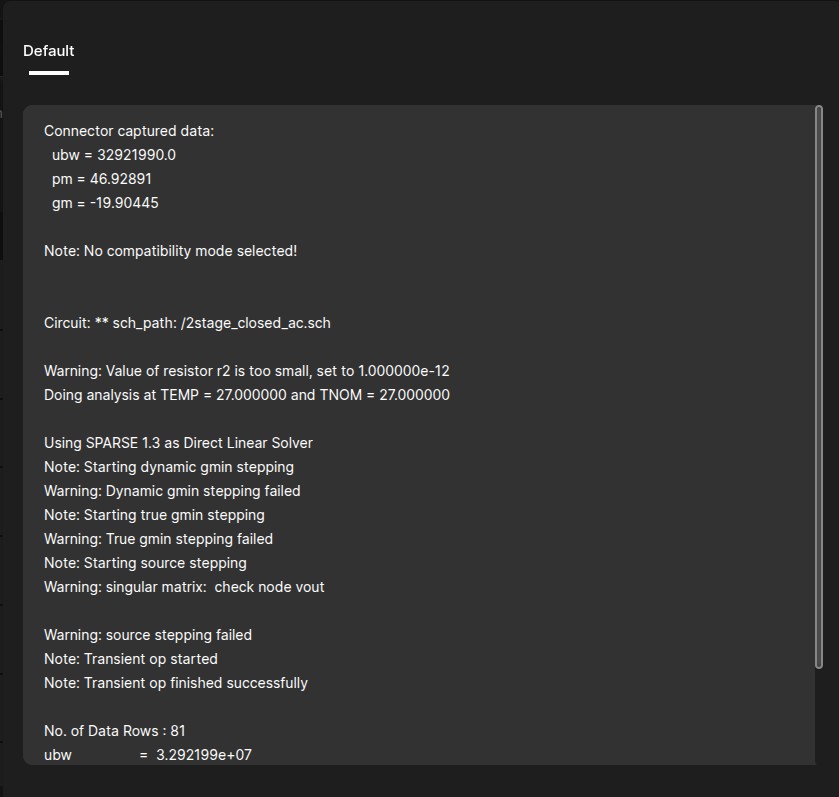
Genie (Optimization)
This page is where circuit optimization is performed, and targets are assigned for the AI agent.
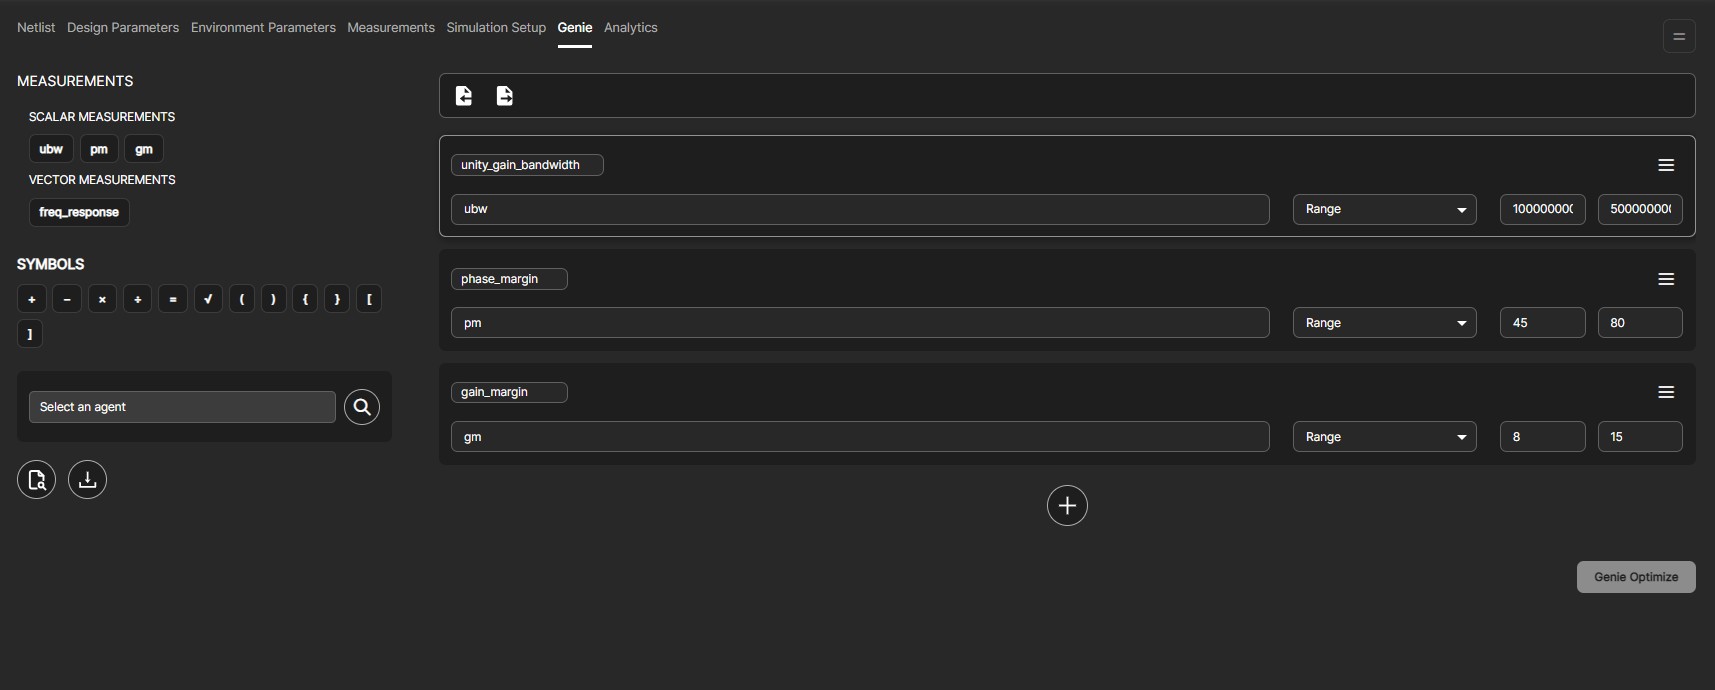
All measurement variables (both scalar and vector) defined earlier will be visible on the top-left of the Genie page.
You may rename expressions if required.
To configure optimization:
- Click Enter Expression
- Select the measurement variable
- Define the optimization goal:
- Minimum
- Maximum
- Range
- Equal to a value
- Provide the target value/range (for scalar measurements)
Multiple expressions can be added using the Plus (+) icon.
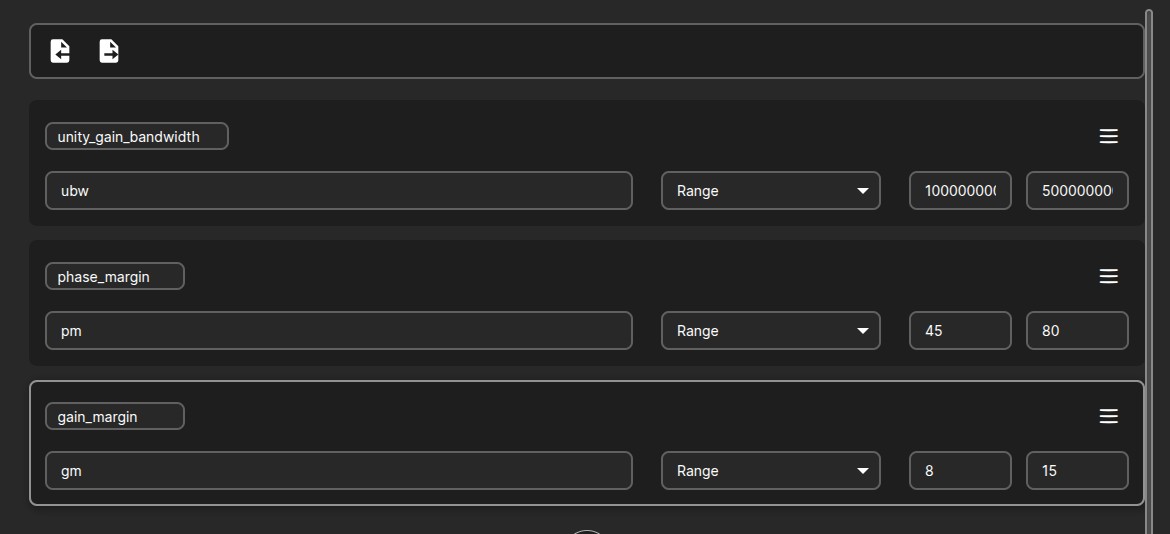
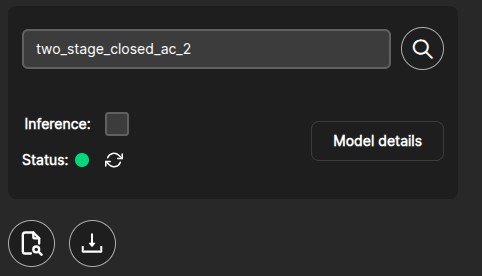
On the bottom left of the Genie page, you can select the appropriate agent for optimization. For this tutorial, the agent two_stage_closed_ac is used.
Click Genie Optimize at the bottom-right of the Genie page.
Open the Chart view to monitor:
- Current iteration measurement
- Best measurement achieved
- Target value
Each optimization iteration is displayed in real time. Previous iterations can be viewed by enabling Show Trail.
Once the target is achieved, download the optimized netlist by clicking the Download icon below the agent selection panel.
Global Resources
Click here to download the complete tutorial resource package: Download Tutorial Resources (ZIP)