Operating Points
In electronics, an operating point (also known as the quiescent point or Q-point) refers to the steady-state direct current (DC) voltage and current of an active device, like a transistor, when no input signal is applied.
Data Capture
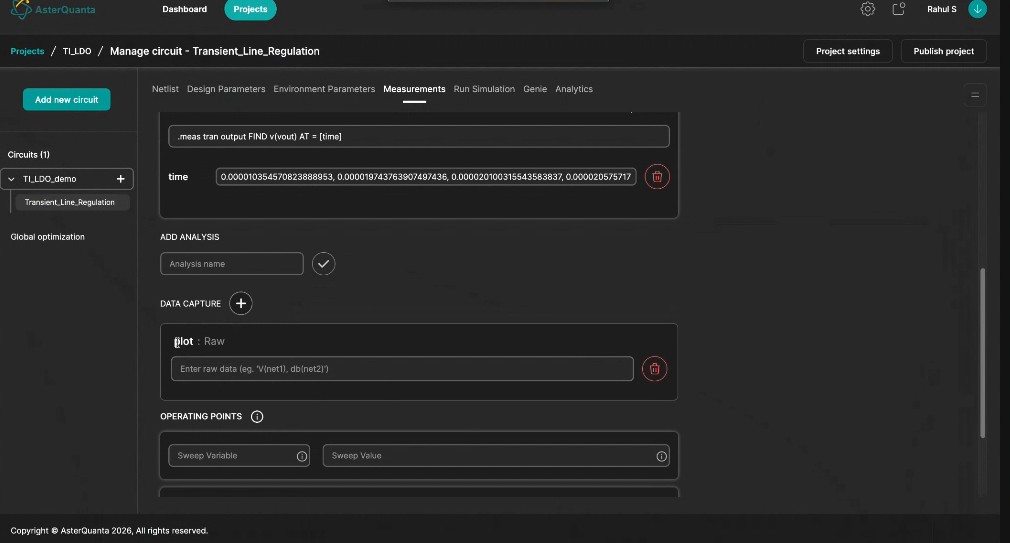
In Data Capture, users can capture and visualize different aspects of the circuit simulation.
If a plot is provided, as shown in the screenshot below, the simulator displays the traces associated with that plot. This can be useful for identifying available traces; however, it is not mandatory for Operating Point analysis. Users who already know the required trace can directly use it as a Sweep Variable in the Operating Points configuration.
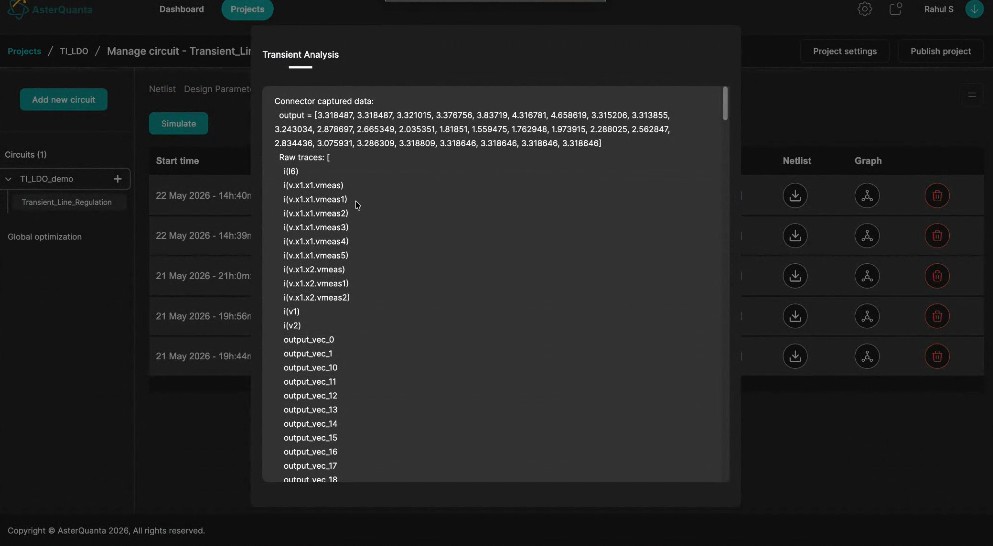
It gives you all the traces that the simulation can trace out, as shown in the screenshot below. For example, the voltage over time for that particular component:
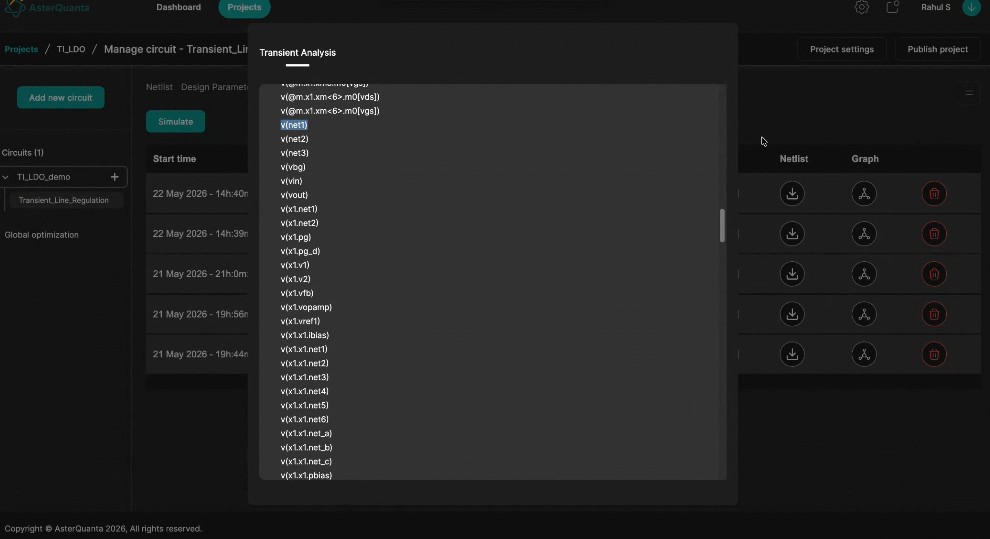
For the highlighted trace below, you can get the operating point:
Configuring Simulation Data
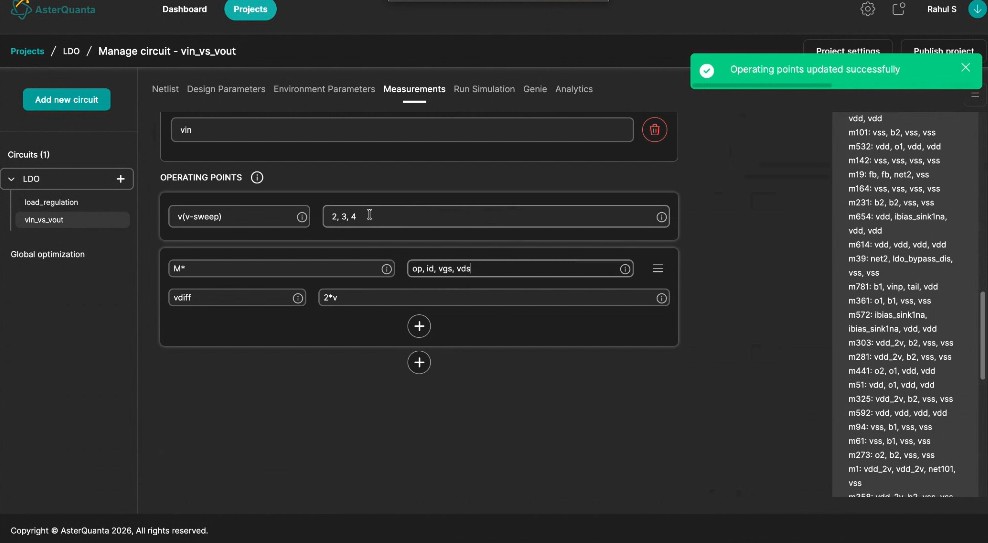
Here you can provide the data for the simulation:
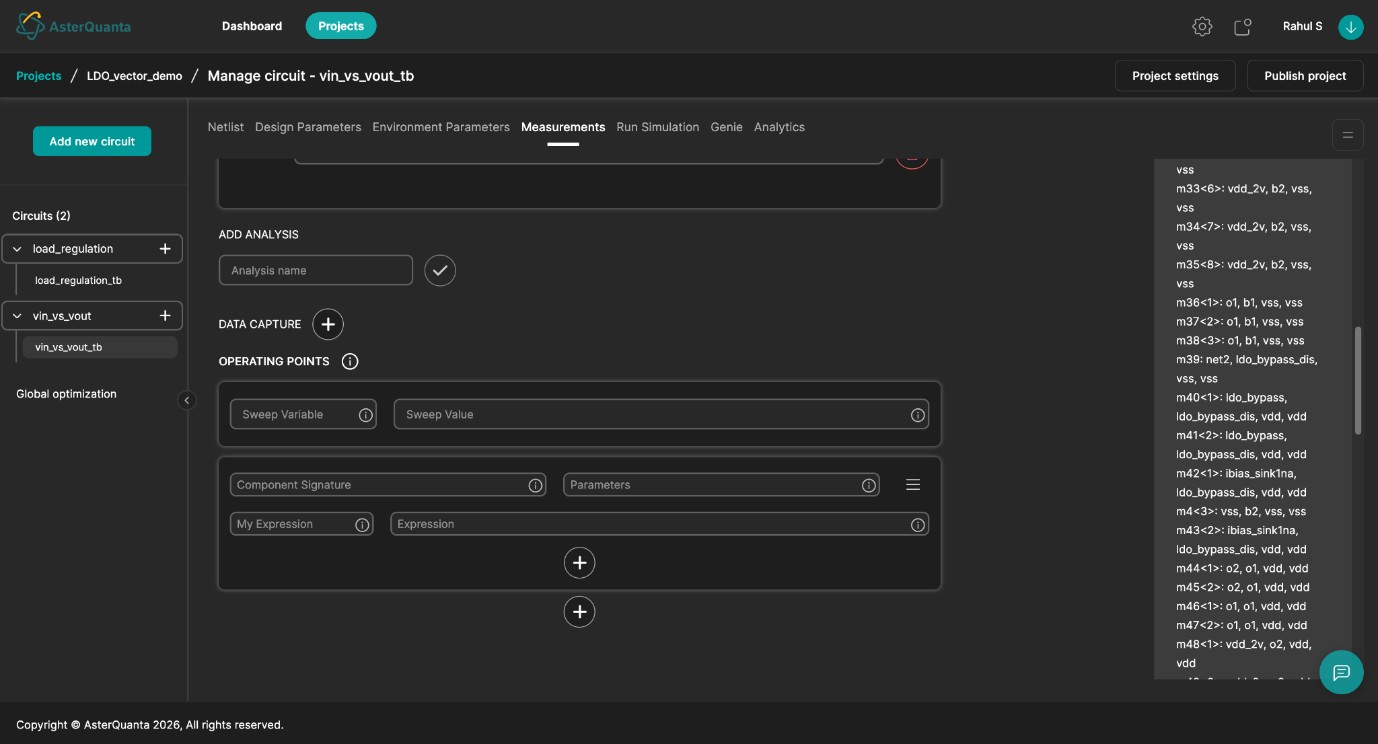
| Field | Description |
|---|---|
| Sweep Value | Can be any value within the min-max given range. |
| Component Signature | The component whose operating point you want to retrieve. |
| Parameter | Located next to Component Signature; specifies which parameter to get the value for. op is a custom parameter that returns data indicating whether the circuit is in saturation, linear, or cutoff stage. |
| My Expression | A custom name for your mathematical expression, used for easier identification of values in the graph chart. |
| Expression | The mathematical expression to be performed on the operating points. |
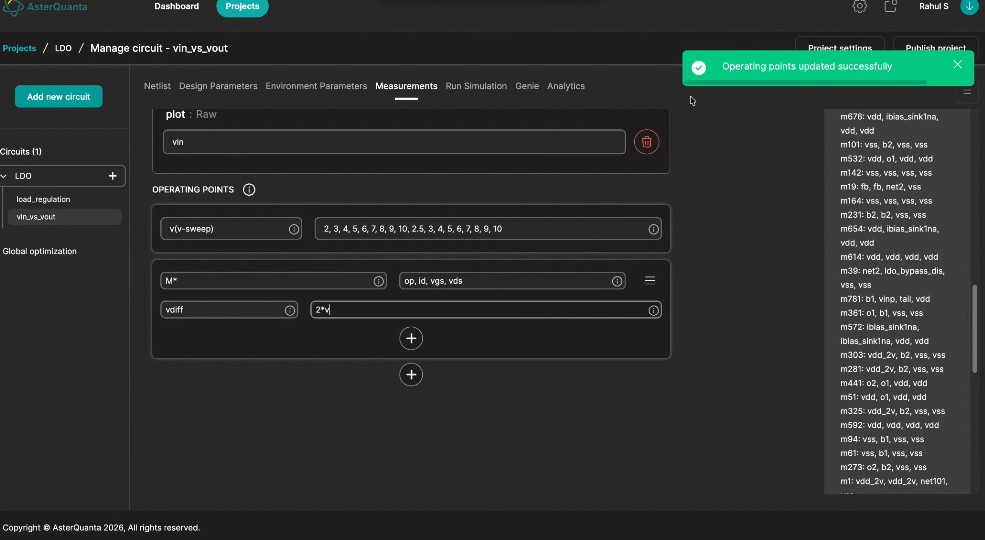
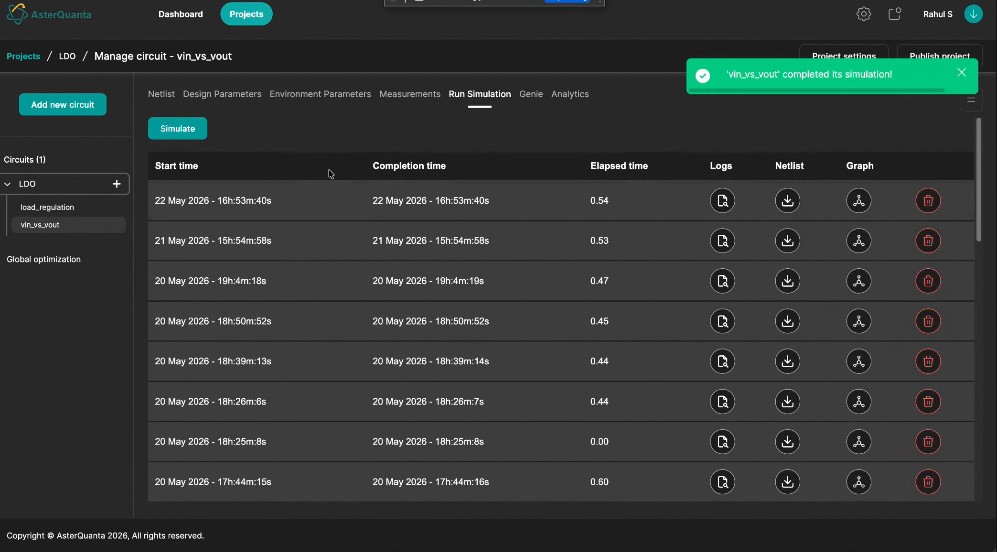
Running the Simulation
After updating, run the simulation:
Then open the graph to see the changes:
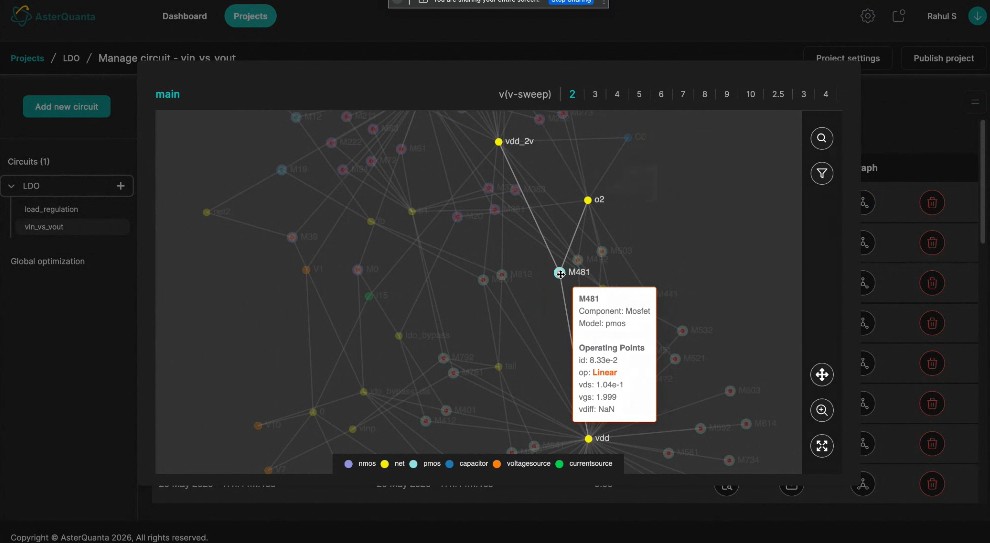
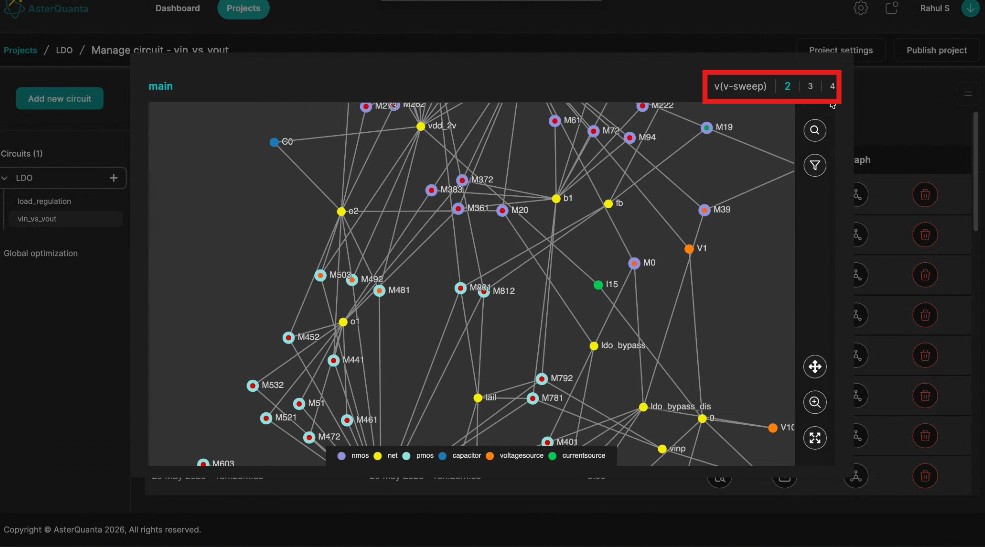
You can see the v-sweep values that were given in the measurements here:
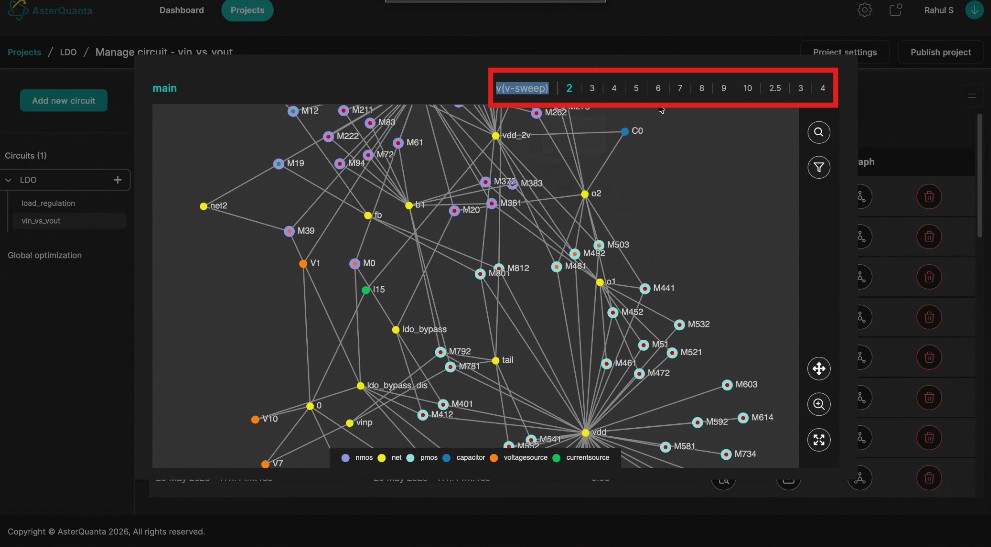
Sweep Value and Swept Value are different:
- Sweep Value — what the user asked for the details of.
- Swept Value — what the simulator returned.

Viewing Results in Analytics
When you go to Analytics and click on your latest optimization, you will see this under Step Quality:
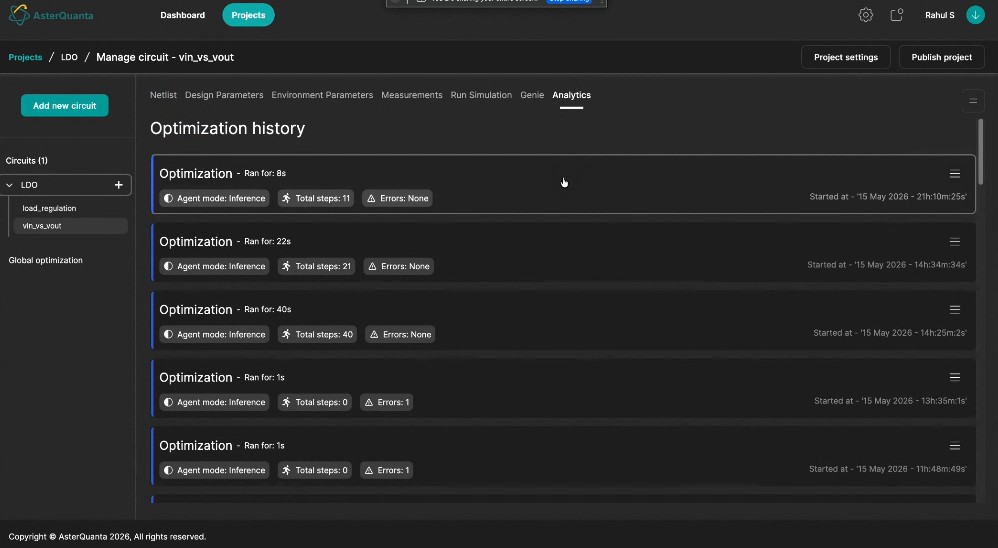
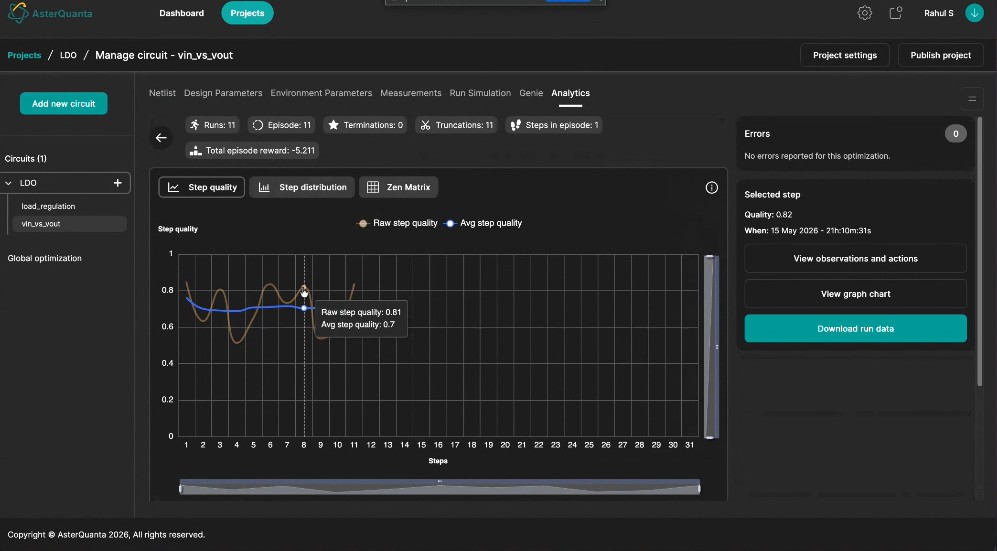
You can view the graph chart for that particular step:
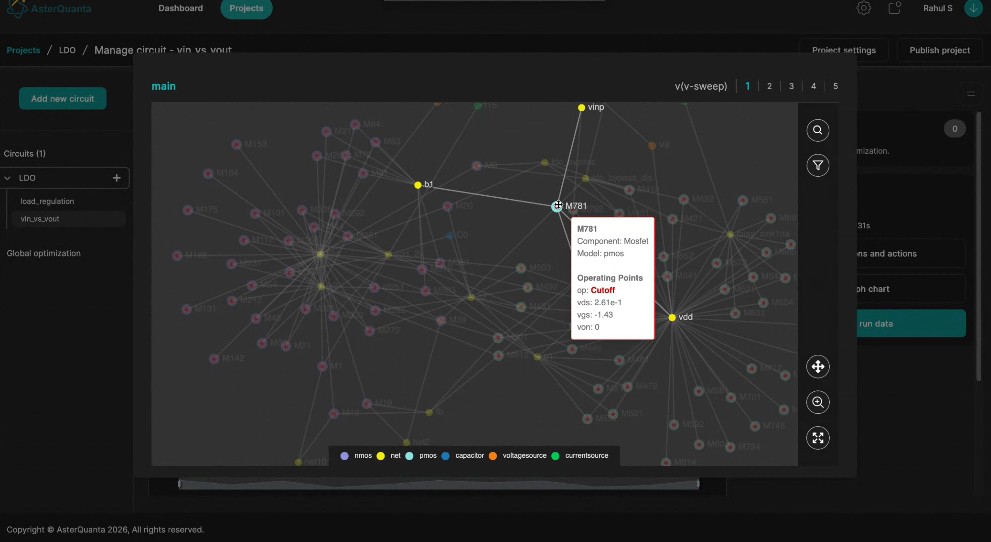
Updating Operating Points
Similarly, if you change the values and update the Operating Points accordingly:
You will have to run a new simulation:
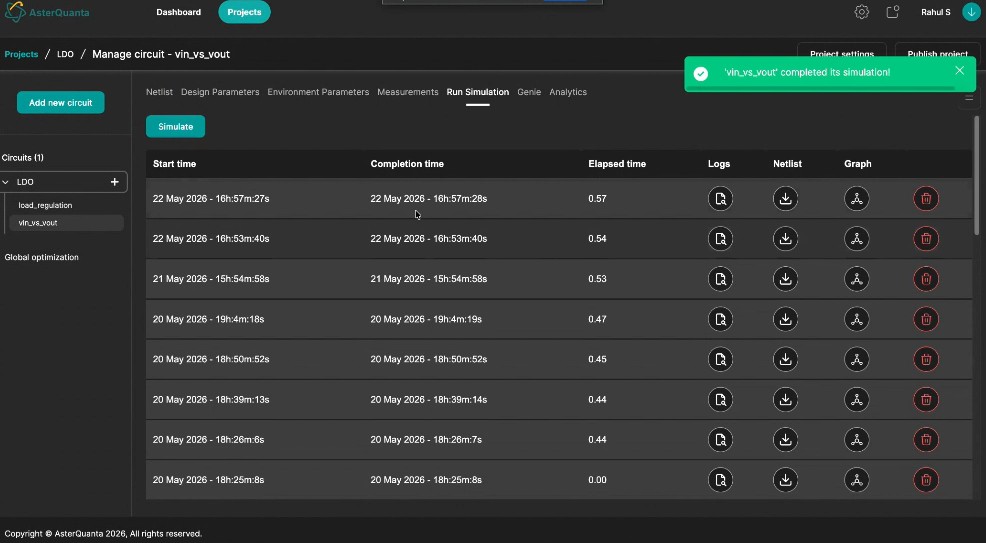
Open the graph to see the updated Operating Points values simulation: